Master Day Trading in Just 30 Days: Lesson #10
20
MARCH, 2016
The prior installment in this series introduced precise rules for the definition of LEGS and SWINGS on a chart. With these rules, chart structure starts to be visible against all the day-to-day (or bar-to-bar) noise. In this installment, we are going to cover trends, and how to define them. Learning to determine the true trend on a chart is probably the most important skill you will develop. Many other traders use moving averages for trend definition and, for the experienced trader, this is a great proxy and probably the only trend definition tool they will need. But for the beginning trader, a more precise, repeatable definition is needed.
Real World Example Of A New Down-Trend
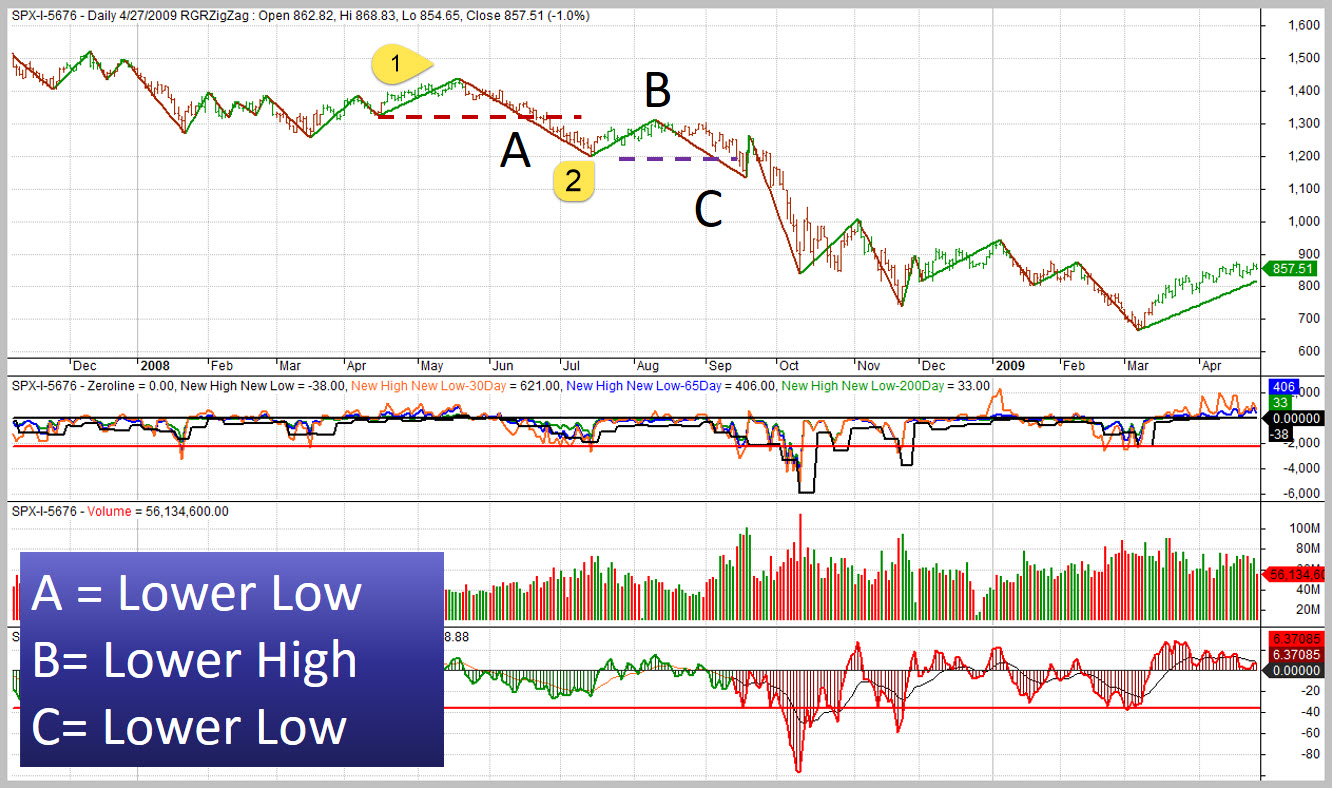
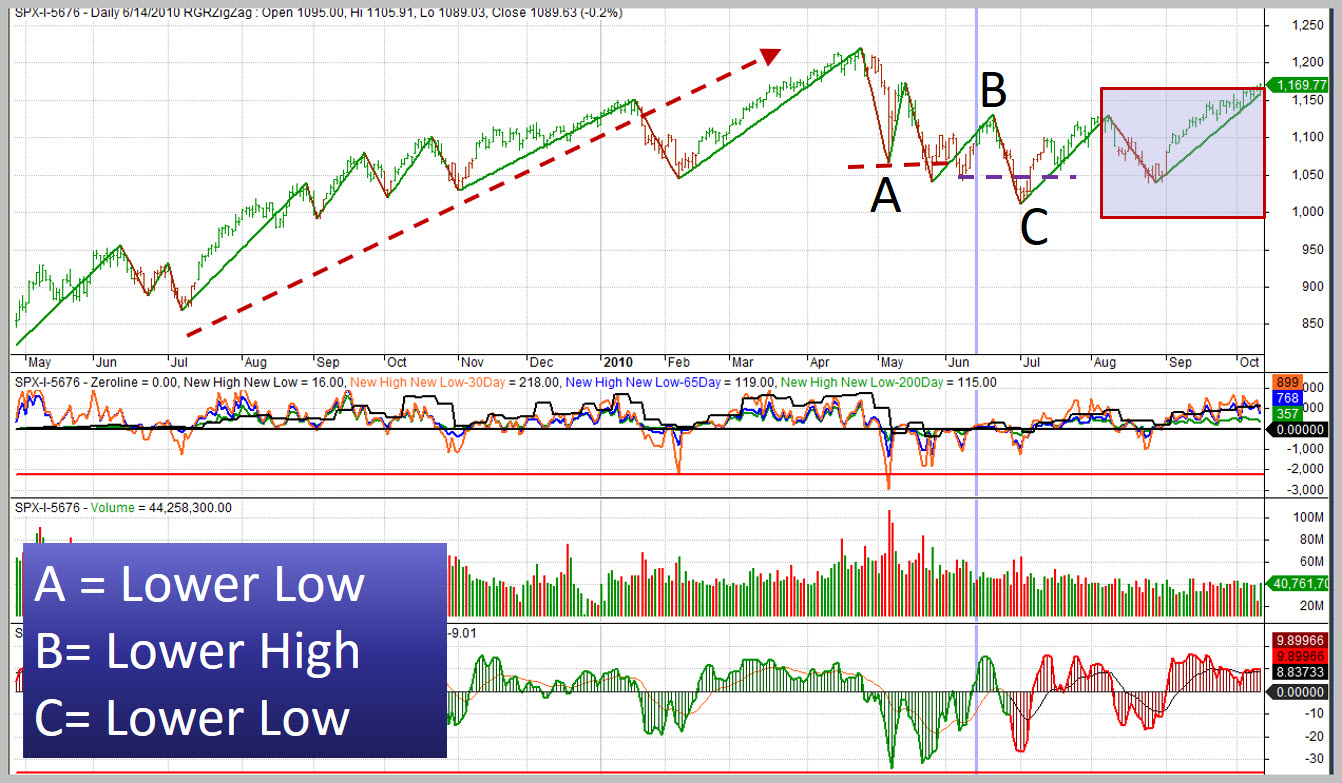
The chart below shows a new down-trend. Prior to the point marked “A”, price was in a sideways line. At point “A” price made a “lower-low”. It is a lower-low because price declined below the last pivot (which is marked by the left-most part of the dashed horizontal red line).
Point “B” is the lower high because it is lower than point “1”. Point “C” is the lower low because it moved below point “2” (or the dashed horizontal purple line).
The down-trend is officially defined when price moved below the dashed purple line.
Note: We realize that this might seem a bit confusing – sometimes you just need someone to walk you through these things. if you have questions about concepts presented in this (or any other) lesson article, a simple 1 hour technical analysis coaching session can get all your questions answered!
In the meantime, lets take a look at an exmple of a new up-trend!
Real World Example Of A New Up-Trend
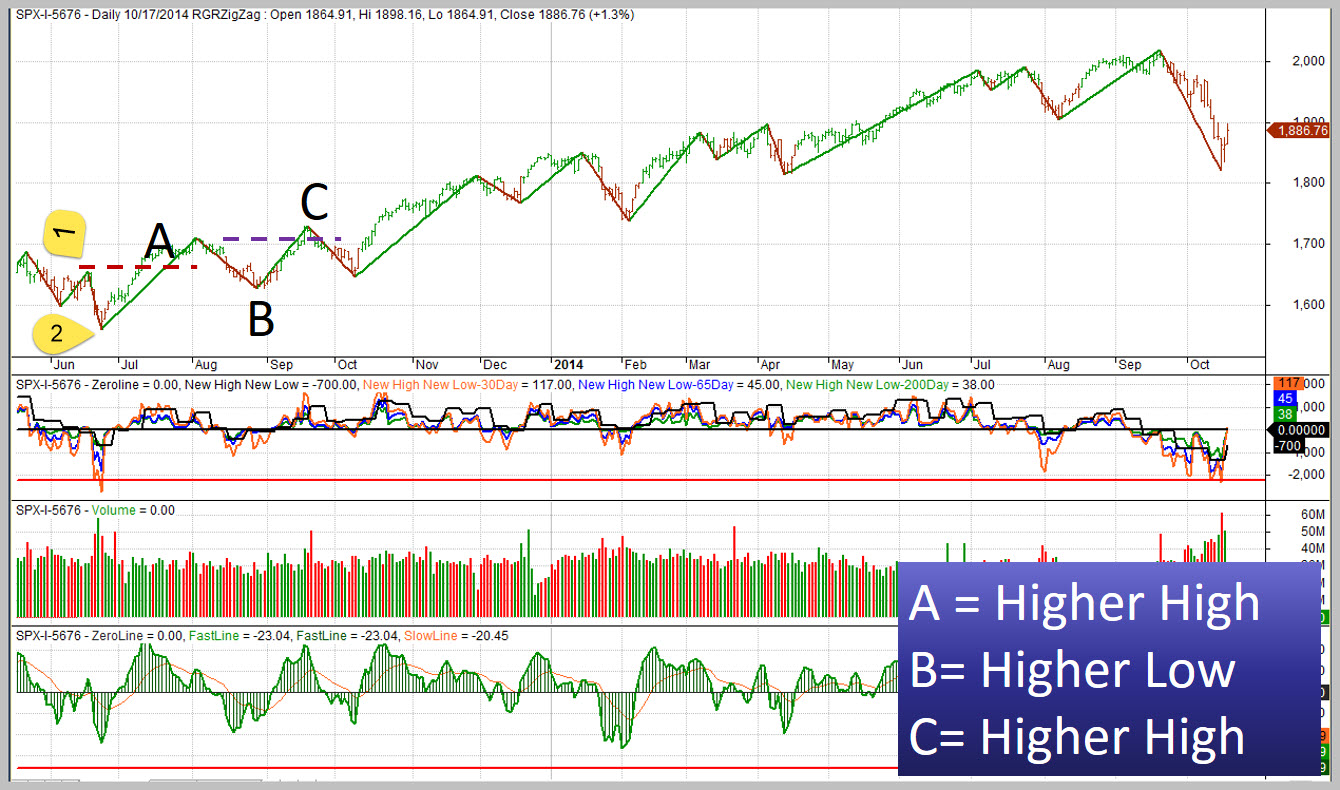
Point “A” in the chart above is the first “higher-high” because it is higher than point “1” Point “B” is the first “higher-low” because it is higher than point “2”. Point “C”, around the area of the horizontal dashed purple line is the start of the up-trend because it exceeds point “A” and becomes the 2nd “higher-high”.
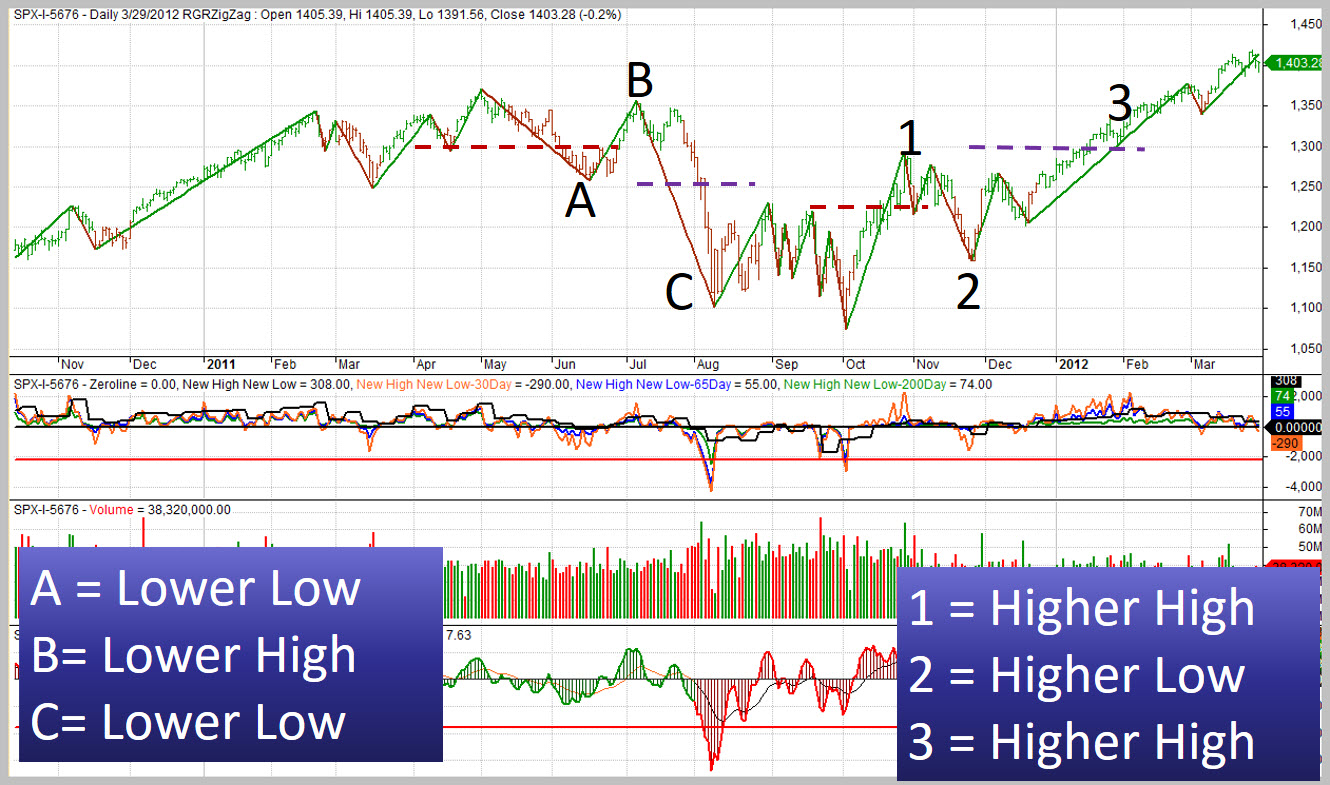
Here are three more examples.
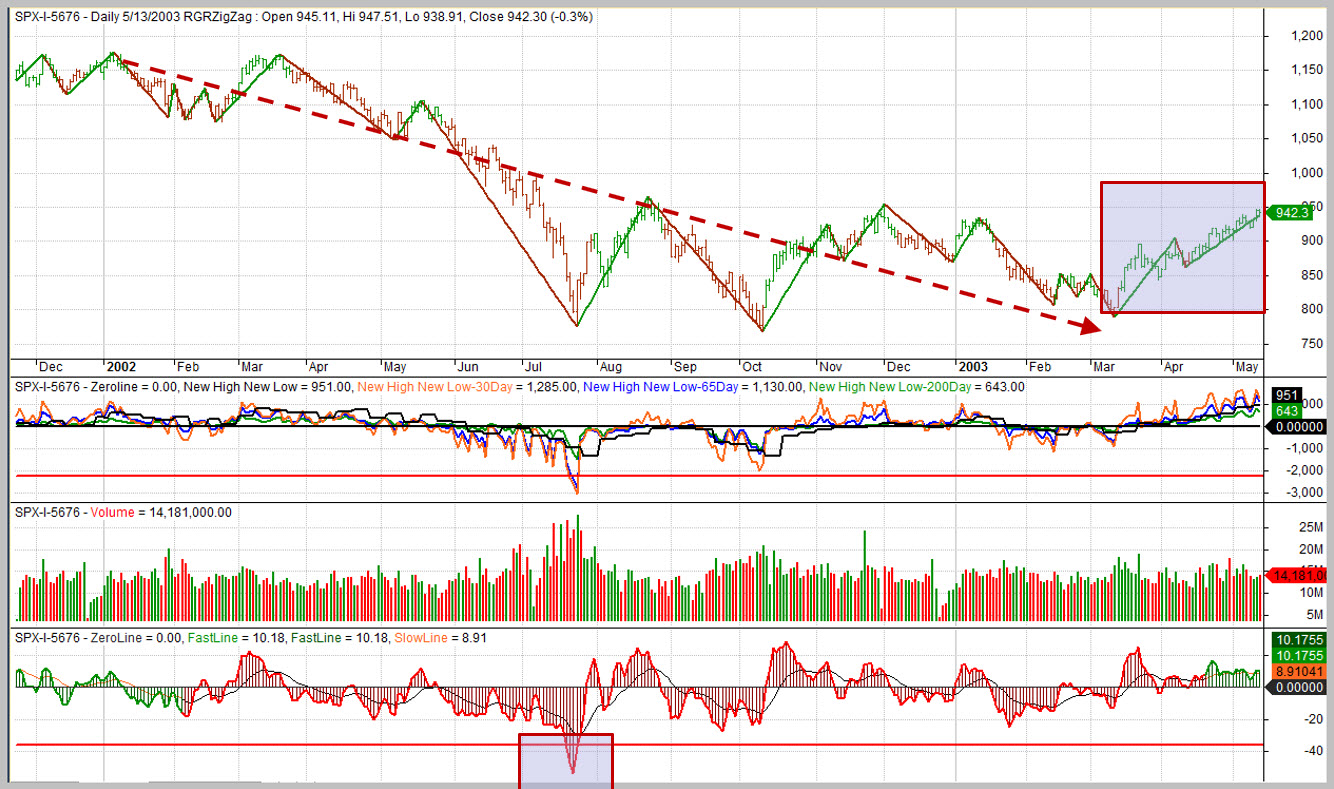
Note that the last one is not labeled – can you see the trend change based on our rules so far?
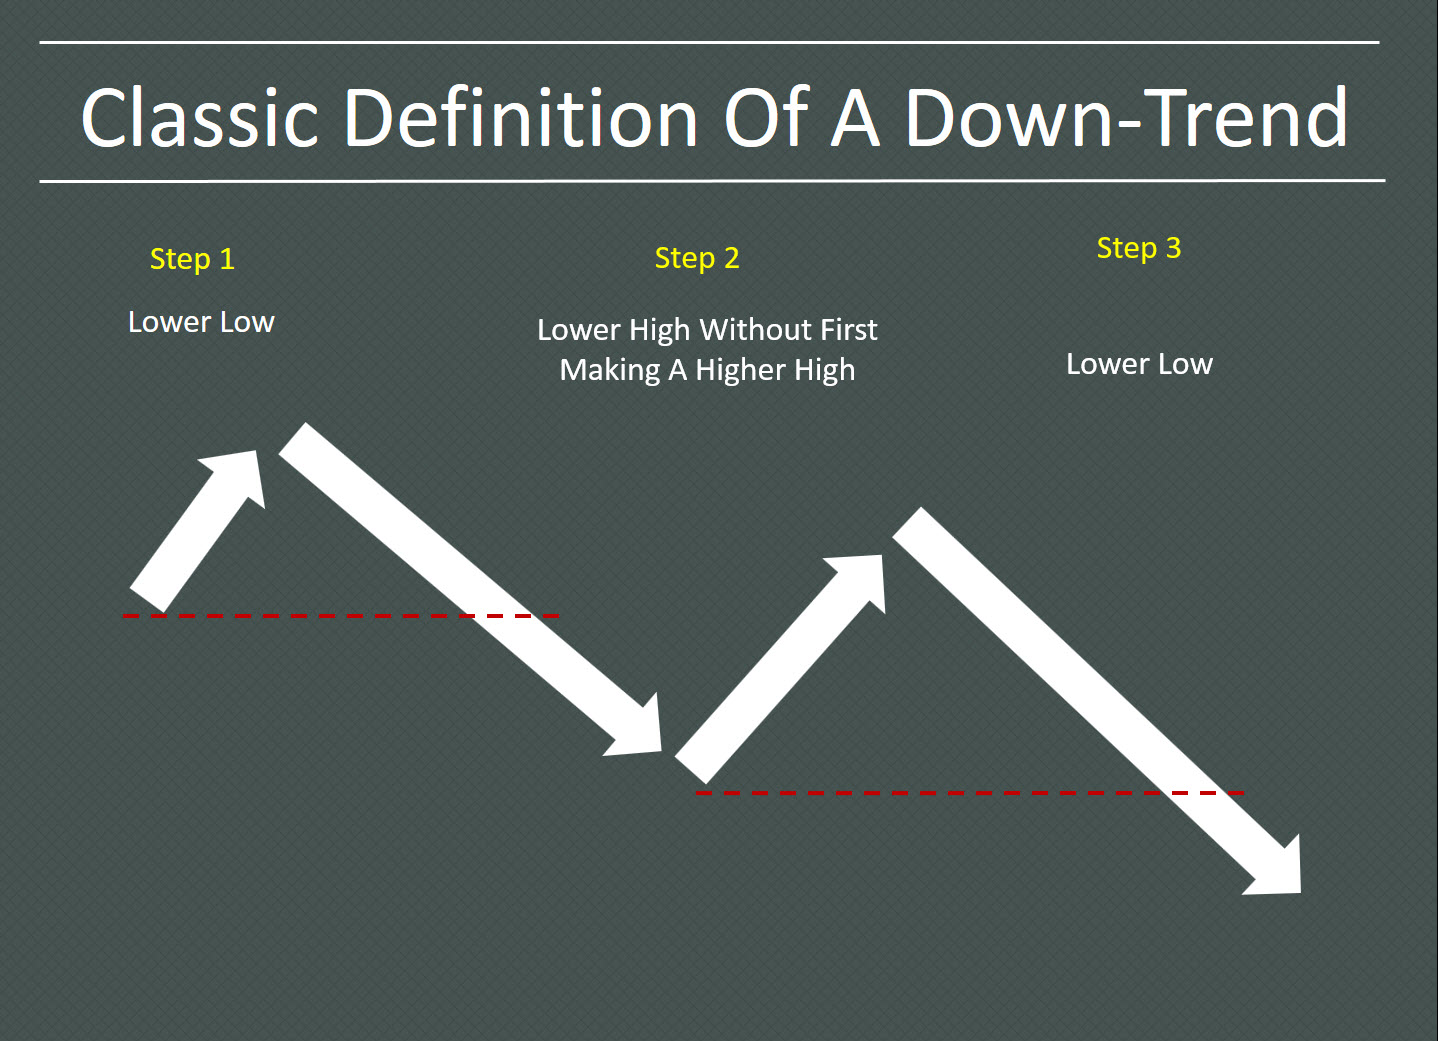
“An UP-TREND is a higher-high, followed by a higher-low and then another higher-high.
A DOWN-TREND is a lower-low, followed by a lower-high and then another lower-low.”
Homework
Your homework is simple – find nine charts where you can clearly identify both a down-trend and an up-trend. You can do this exercise on intraday timeframes such as the 15 min charts or the 60 min charts.

Terminology
Photograph provided by shutterstock.com
Terminology
For this lesson, we introduced the following terms:
Higher-High: Occurs when price moves above the prior swing high.
Higher-Low: Occurs when price is moving down but then turns back up before reaching the prior swing low. This creates a new “pivot” that becomes the “higher-low”.
Lower-Low: Occurs when price moves below the prior swing low.
Lower-High: Occurs when price is moving back up but turns back down before reaching the prior swing high. This creates a new “pivot” that becomes the “lower-high”.
How do you feel after you have completed this exercise? Let us know by using our contact form! We would love to hear from you!

Wrap Up
In this lesson you finally learned how to determine the trend of a market. This is a concept that will be fundamental in every trade you initiate. 90% of the time you will be trading in the direction of the trend so this skill is key to your success as a trader.

Coming Up Later
- Using the trend to set up scalp trades
- Using multiple time-frames to fine-tune your trading entries
- Determining how to set your stop points and the trade-offs of each tactic
- Understanding trading as a numbers game


