Master Day Trading in Just 30 Days: Lesson #15
15
Lesson #15
We spent the last few lessons drilling Trend Reversal concepts into your head. This lesson takes a step away from that and starts to look at support and resistance levels.
Being able to identify points of support and points of resistance is going to be critical to your trading success.
The concept behind SUPPORT and RESISTANCE is simple – if price has paused at a particular level before, then chances are that it will do so again.
So, if price is falling but then pauses around a certain price level, we say that the area or price level is acting as SUPPORT.
Similarly if price is rallying but then pauses at a price level and falls back, we say that the area is acting as a RESISTANCE level.
Many times, prices will eventually break above a resistance level or fall below a support level. The interesting thing that happens thenis that the prior resistance level becomes a new support level! And the prior support level becomes a new resistance level.
Now, there are certain types of price behavior that increases the odds of price pausing and reversing which brings us to our next point:
There are two types of SUPPORT and RESISTANCE levels that we prefer. The first is “swing” highs and “swing” lows. The second is consolidation levels. Many times, swing highs and swing lows will also form in the area of prior consolidation levels.
Swing Highs and Lows
Swing High: A swing high is formed when a price bar is surrounded on either side by bars with lower highs.
Swing Low: A swing low is formed with a price bar is surrounded on either bside by bars with higher lows.
Example #1: Swing Highs
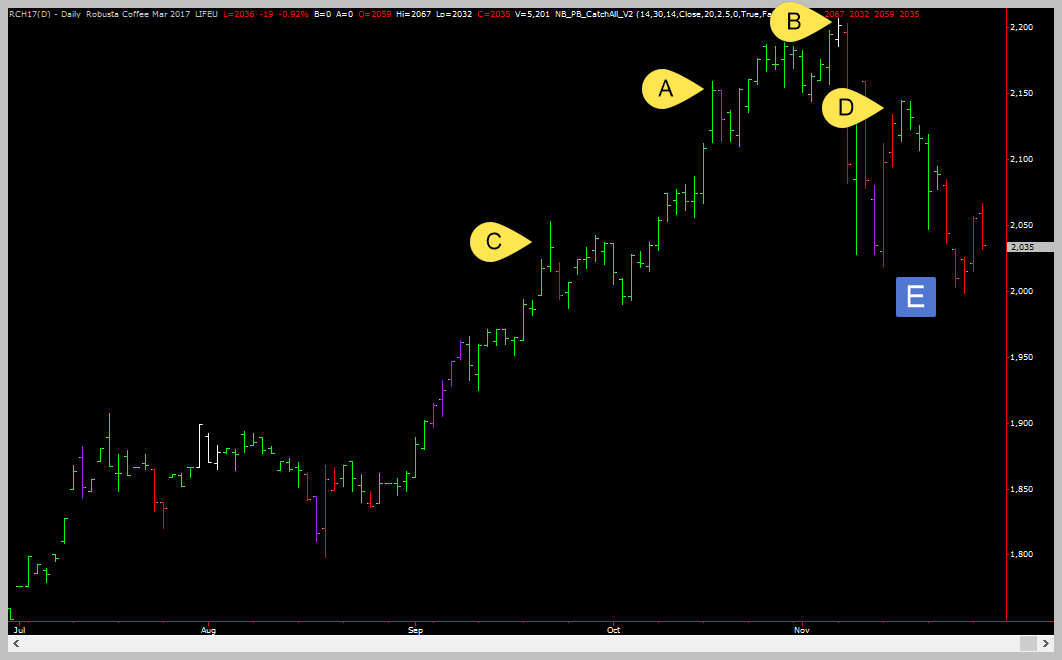
In the chart below, each of points “A”, “B”, “C” and “D” are swing highs because each of the bars on either side of them have a high price that is less than the high of the swing bar.
Point E, however is a SWING LOW. Notice that it formed right in the area of the swing high created by point C. Point C is a prior resistance area that was ultimately broken through. Thus, it became a support level, validated by the price action around the area of point E.
Example #2: Swing Lows
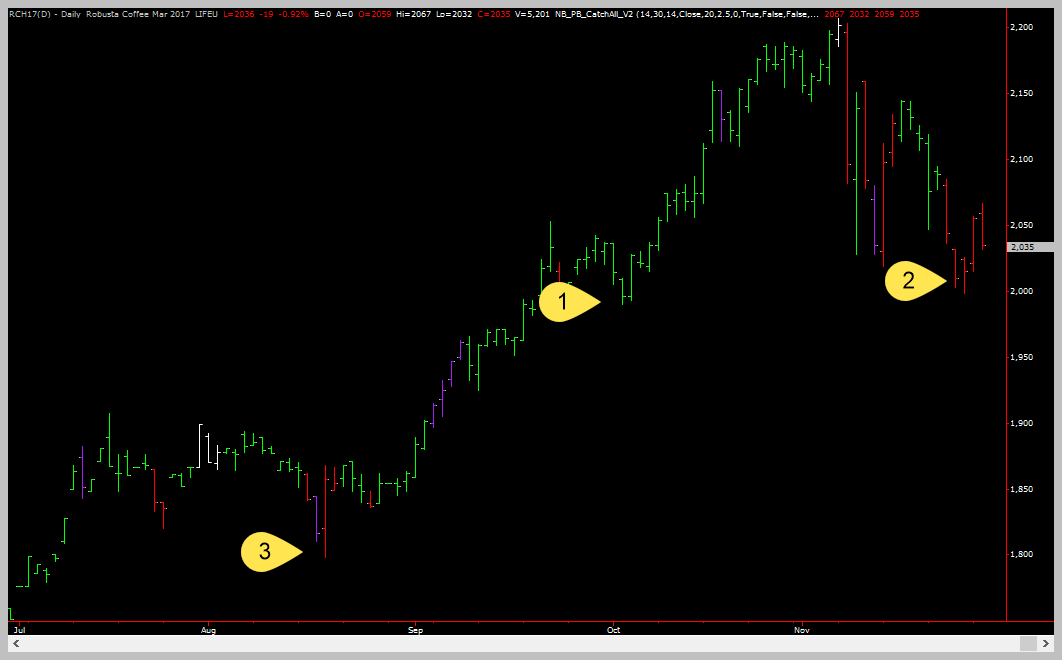
Points 1, 2 and 3 on the the above charts are swing lows. This is because each of the bar on either side have low prices that are greater than the low price on the swing bar.
Learn About Identifying Tops And Bottoms
Why Swing Points Are Important
Many times prices retrace to prior swing highs and swing lows and then pauses there before resuming the main trend. Lets take a look at the same chart examples from above…
Swing High Acting As Support Level
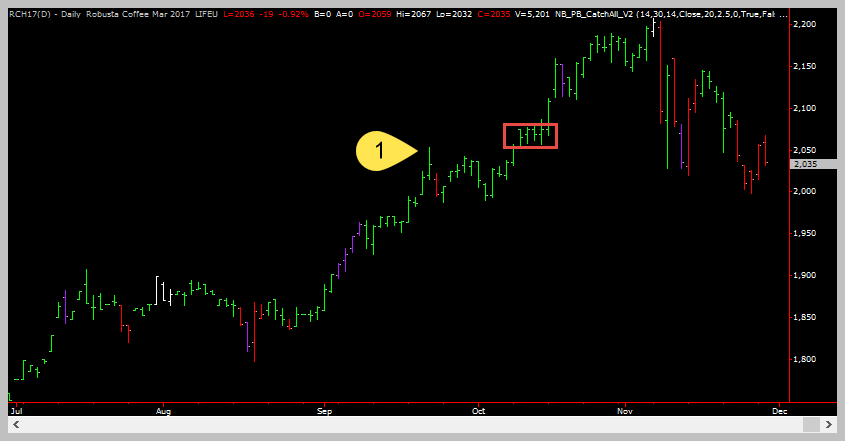
In the chart below, point 1 is a swing high. But notice the red box to the right hand side. When price exceeded point 1, it [point 1] became a SUPPORT level.
You can see that point 1 is acting as a support level because every time prices in the red box fell to the level of point 1, prices rallied. Eventually, it moved completely away from point 1. (The next example shows where the price continues to act as support even weeks later!)
Additional Examples…
Chart images provided by Tradestation Charting Software
Swing High Acting As Support Level
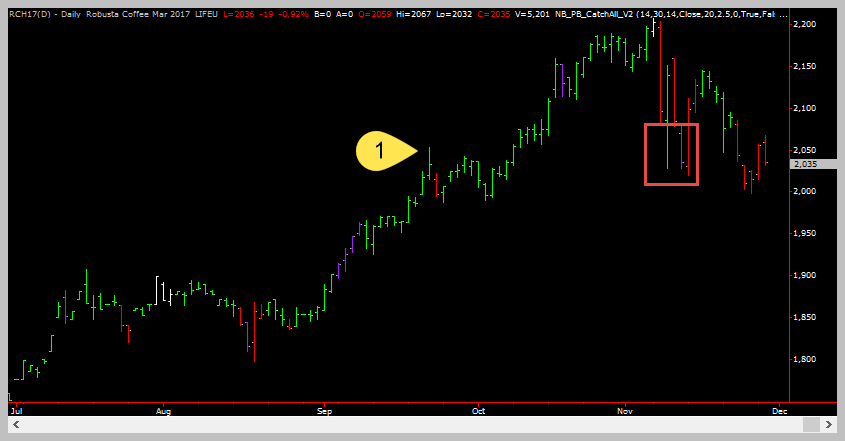
In the chart below, point 1 is a swing high. But notice the red box to the right hand side. When price exceeded point 1, it [point 1] became a SUPPORT level.
You can see that point 1 is acting as a support level because every time prices in the red box fell to the level of point 1, prices rallied. Eventually, it moved completely away from point 1 – only to come back again to try to break it down (see the right hand side of the chart!)
Swing High Acting As A Resistance Level
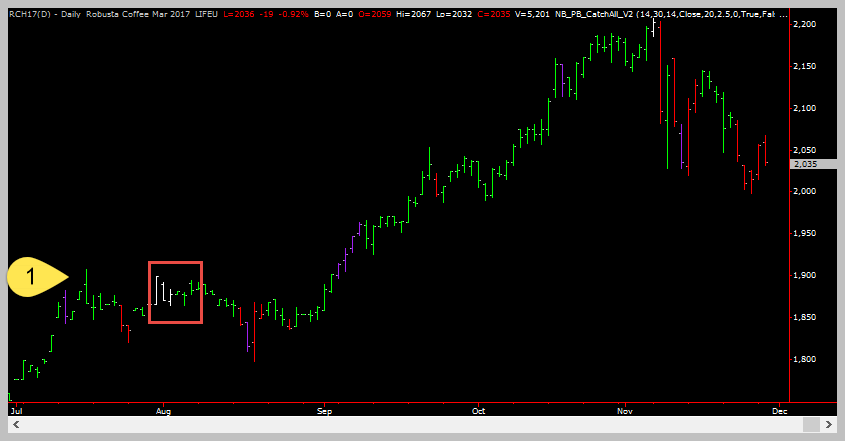
In this example, point 1 is a swing high. Notice that the prices in the red box kept rallying towards point 1 and falling back. This was point 1 acting as resistance. Eventually prices gave up and fell back for most of the month of August.
A month later prices finally broke through the point 1 level and continued to rally. If prices ever fell back towards point 1 chances are that it will act as support and take multiple attempts to break down below it.
Not All Swing Points Are Equal
Not every swing point is going to act as a support or resistance level. However, unless there is evidence to support otherwise, its best to just assume that it will act that way. This is especially true if price approaches a swing high or low again for the first time.
The best swing highs/lows are created with large bars and high volatlity. You will notice lots of points on a chart that are swing highs/lows but that seem to do nothing later – chances are those are just average volatlity swing highs and lows. The important swing highs/lows will capture your attention almost immediately – you shouldn’t have to go hunting for them. Instead, the good ones make it very hard for you to ignore them on the chart!

Wrap Up
This lesson covered two things
- The concept of SUPPORT and RESISTANCE
- One of our two favorite support and resistance points on a chart.
In our next lesson we will cover consolidations as support and resistance levels.

Coming Up Later
- Consolidations as support and resistance levels
- Money management and risk control
- Using multiple time-frames to fine-tune your trading entries
- Determining how to set your stop points and the trade-offs of each tactic

