Master Day Trading in Just 30 Days: Lesson #17
17
Lesson #17
In this lesson we will discuss the concept of “multiple timeframes”. This is another very important – almost critical – idea that can be very useful in constructing your trades so that you reduce the initial risk that you take.
Here is how this works…
As we’ve discussed on multiple ocasions you need to first identify the dominant trend in the market you are trading. Generally this is done on the daily charts. But many professional day-traders will never initiate trades based on just the daily charts. Instead, they will use an hourly or even 15 min and 5 min charts to enter and exit trades. And they will only do so in the direction of the trend on the daily charts.
Why?
The reason is simple – you can set a risk point (usually the prior swing high or low on our standard red-green chart swings) that is much much smaller than you could on a daily chart. Additionally, you can find more trade set ups on smaller time frames (though, of course, you also somewhat limit how much you can make on the trade.)
The trick is finding a pattern on the hourly/15/5 min charts that is in sync with the trend on the daily charts. For the purposes of this lesson series there are three patterns to look for on those shorter time frames:
- Trend Reversals
- Breaks from consolidations
- Support and Resistance levels
Here are some examples that might help to reinforce the idea for you:
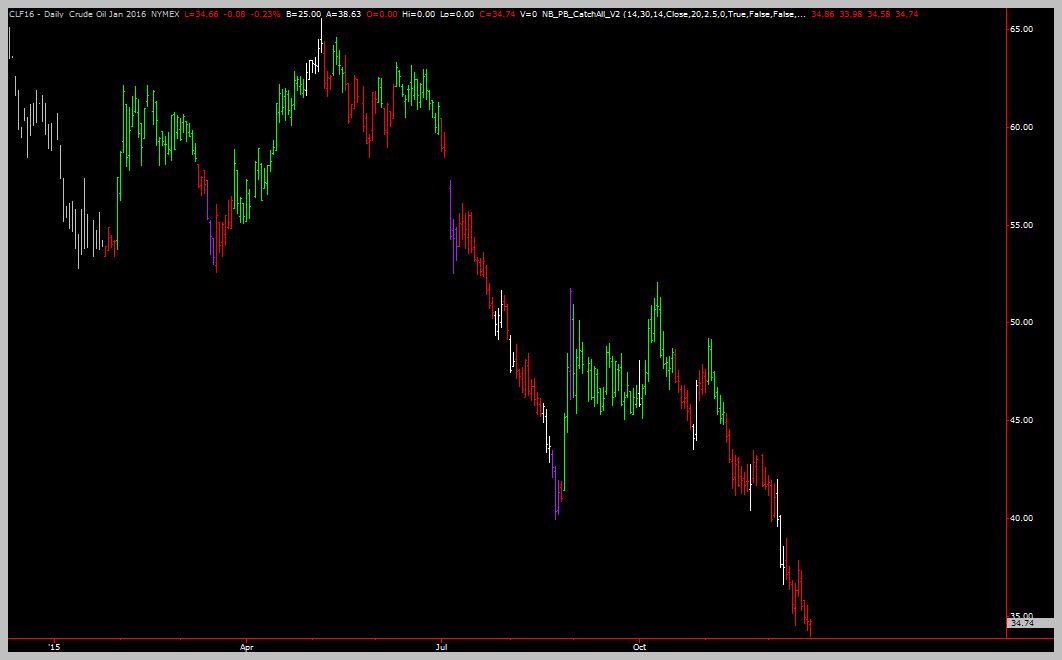
Example #1: Jan 2016 Crude Oil
What is the trend on the daily chart? For this market it was clearly DOWN.
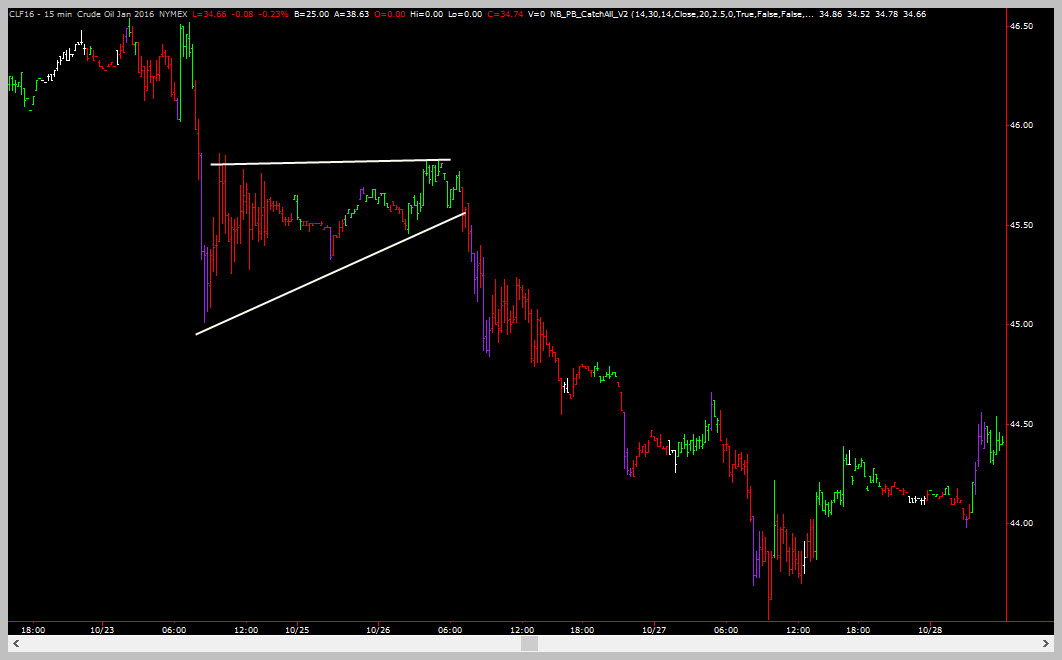
On the 15 min chart, a trader would then be looking to find patterns to trade in the direction of the daily trend.
Here is one such pattern – a breakdown from a nice consolidation level on the 15 min chart.
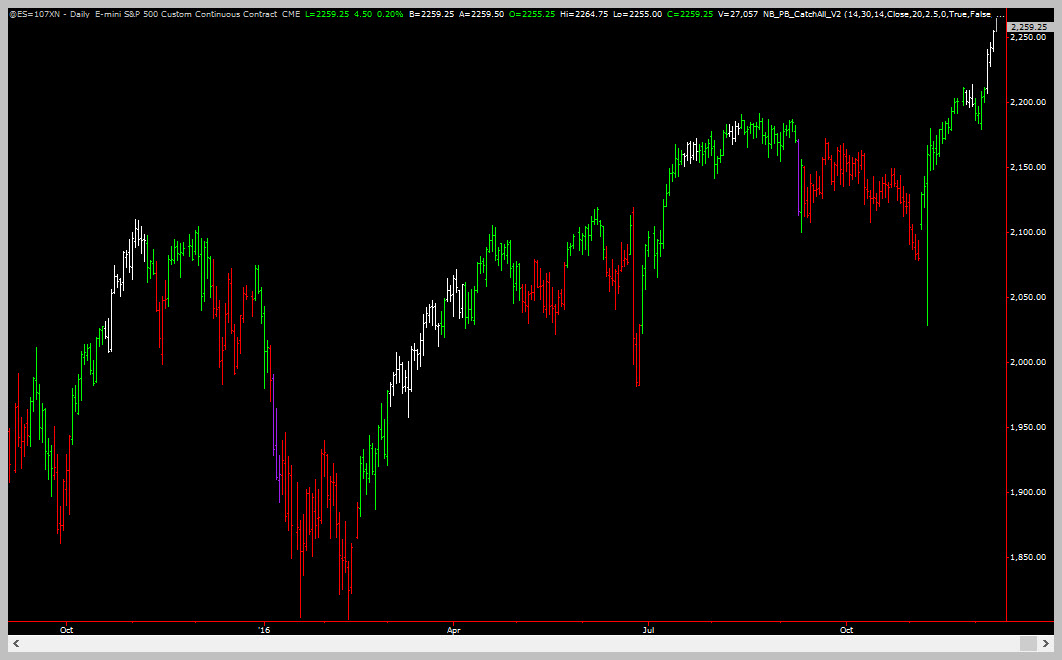
Example #2: December 2016 e-Mini S&P
What is the trend on the daily chart? For this market it was clearly UP.
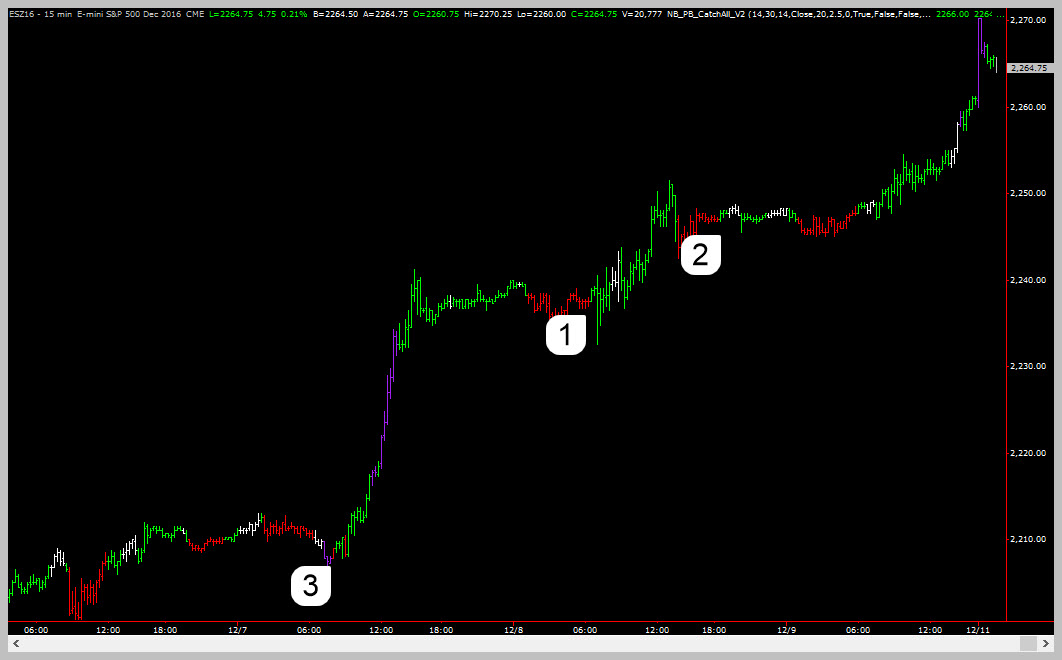
On the 15 min chart a trader would be looking to make long trades. What is the trend on the daily chart? For this market it was clearly UP.
Here are a few points where a trader might have traded to the long side. At points 1 and 2, the swing switched from RED to GREEN.
Those are great entry points.
Point 3 is a POWERBUY entry which was also a great entry point.
In all three cases there would have been clearly defined risk points that were much much smaller than trying to trade to the long side on a daily chart.
Example #3: EURUSD (FOREX)
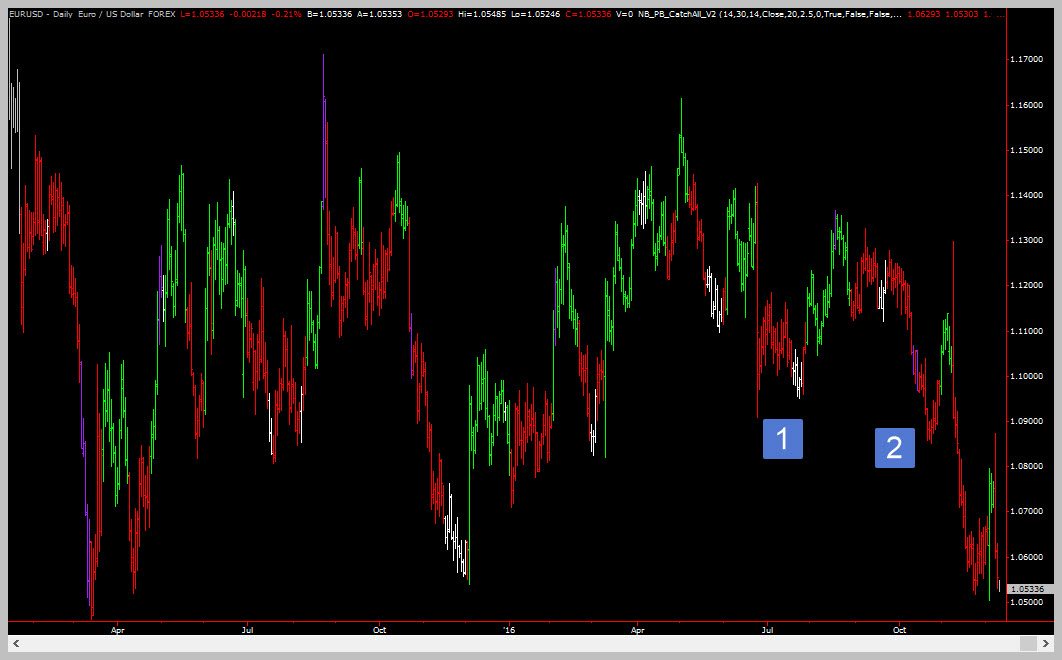
What is the trend on the daily chart? For this market it was DOWN.
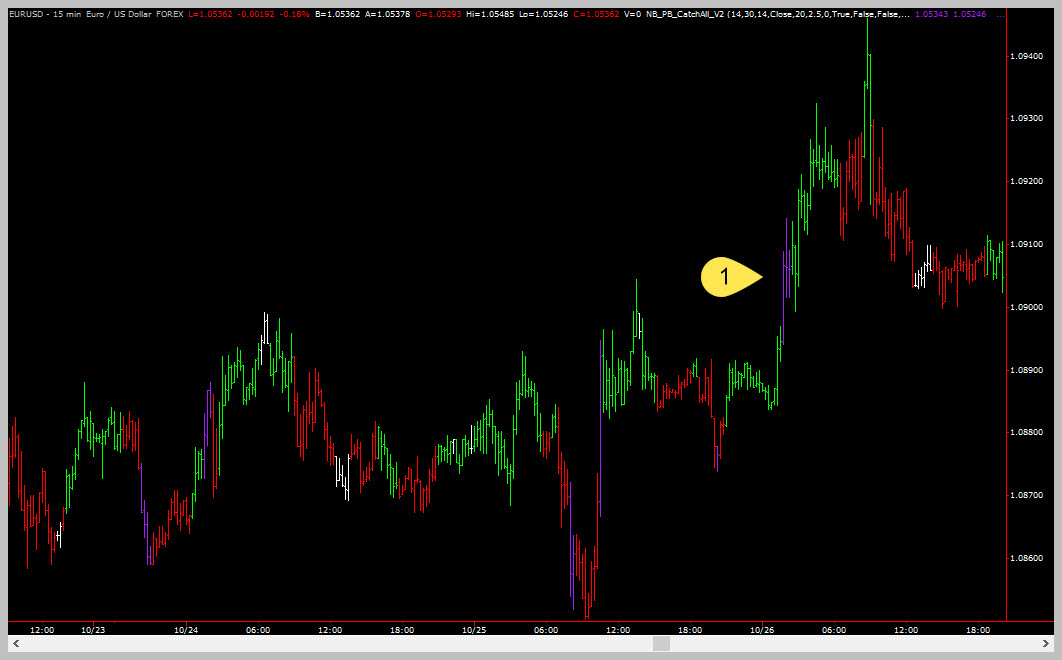
On the 15 min chart a trader would be looking to make short trades. But for this example our trader is going to try to be a hero and trade against the trend.
Point 1 was a prior pivot, making it a short-term support area. So, when price flushed down there again (point #2), our hero trader decided he would attempt a long trade.
But, our trader was a smart hero trader. He decided to wait for a trend reversal.
That opportunity came 3 days later (point 1 in the above image). Since the daily trend was down, this particular trade didn’t get far. But because the trader used the lower time-frame, his risk was reduced so even if he was stopped out, his loss would have been minimal.
The Rules
Basically, when using multiple time frames for trading (and you should ALWAYS use multiple time frames for trading) the rules are as follows:
- 1. Determine the trend on a higher time frame (usually the daily chart or the weekly chart)
- 2. Select your lower time frame and use one of the following patterns to enter:
- Trend Reversal
- Consolidation Break
- Simple swing (color) change in the direction of the trend
That’s it! It’s very simple, right? If you said yes to that, you’re well on your way to becoming a trader! But, if for some reason things aren’t making sense a simple 1 hour technical analysis coaching session can get all your questions answered!
Learn All About Consolidations And Breakouts
There are rules that determine when and how to draw the trendlines, how to play breakouts, where to set your stops etc. A total of 5-7 rules that govern everything related to consolidations!

Wrap Up
In this lesson you learned how using multiple time frames can help you structure trades with reduced risk. We discussed determining the trend on a higher time frame and using the lower time frame to fine-tune your entry.
We’re getting close to the end of our lesson series. But we still have a few more lef so see you in the next lesson!

Coming Up Later
- Money management and risk control
- Determining how to set your stop points and the trade-offs of each tactic

