S&P500/ES Hourly Trade Setup
05
December, 2016
Early last week we published a post about the easiest trade you might be able to make all year. Basically, it advocated buying pullbacks on the hourly charts and holding on as long as you can.
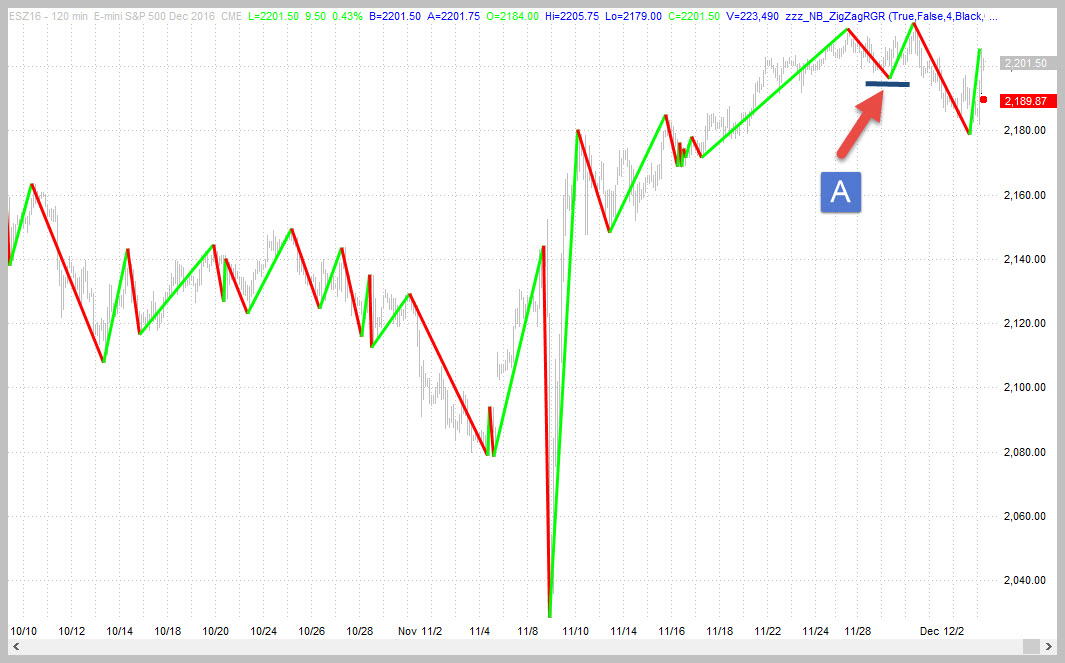
Well, overnight the ES chart completed a pattern that generally leads to new price highs.
The pattern is something we call a “Power Buy” – a sort of a bear trap. The term is one that was coined by Linda Rasche many many years ago – we like it because it really does speak to the potential power behind the trade. Lets take a look at the chart.
The image above is a 120 min chart of the DEC 2016 ES futures contract traded on the CME. When price moved below point A, the bears thought that a down-trend had formed and rushed to short. But that is not a true down-trend. When price created the next green swing (which happend overnight), it created a long trade set up that trapped all the short players.
So, here is the sole trading idea for today
Entry: Buy ES around 2201.50 (SPY equivalent would be around 221)
Exit: Trail a stop on the hourly charts
Protective Stop Order: 2178 (basis DEC 2016 ES)
Usually we give you three trading ideas but with this set up there is really only one way to play it. And it either works or doesn’t.

ES Powertrade Setup
Photograph provided by shutterstock.com
Wrap Up
ES / SPY hourly charts have created a long trade set up that can lead to new highs. There is only one way to play this – buy with a specifc protective stop level and hang on for the ride.
Tiny time-frame players scalping intraday should be looking to work the market from the long side.
PS: don’t forget – if you have questions about the techniques used in this article, a simple 1 hour technical analysis coaching session can get all your questions answered!


