Analysis: US S&P 500 Breakdown (Short Term)
03
November, 2016
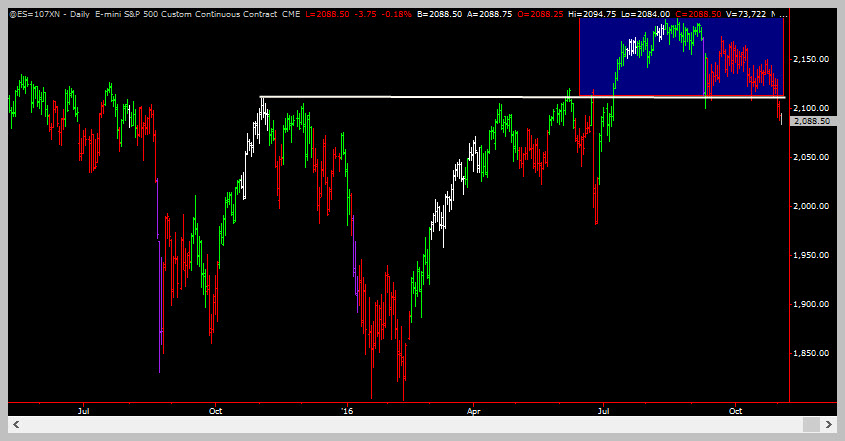
The S&P 500 index officially broke down from a multi-month sideways line on Wednesday. Even though the overall market is in an uptrend, breaks from sideways lines trump the primary trend and need to be respected.
Breaks that go against the primary trend are at higher risk for false breakdowns and whipsaws though – something we need to keep in mind. Regardless, when a multi-month consolidation is broken, it could signal the very early stages of a new trend.
Lets take a look at the charts so we can highlight the breakdown pattern.
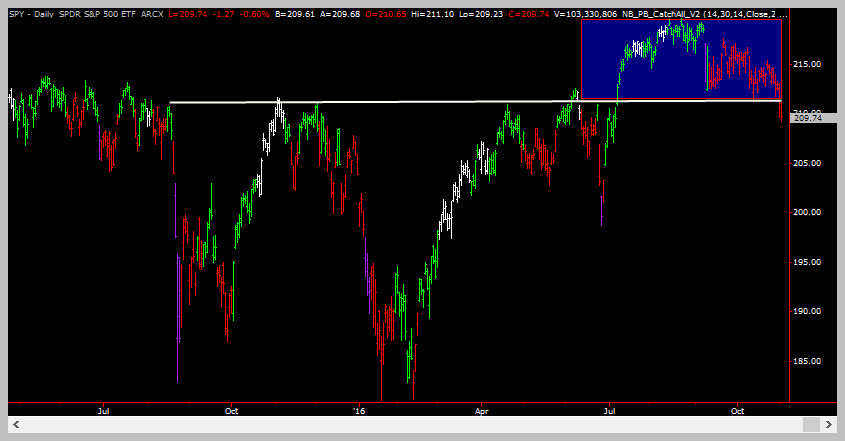
The above image is a chart of the ES (S&P e-mini futures traded on the CME.) The white line is the support level while the blue box highlights the four month consolidation. The same formation is present in stock ETFs – see the chart below
Potential Trades
There are three potential trades that you can prepare for. One is immediate and two others require some patience. All three are list below using the ES contract as the trading instrument and uses the DAILY charts as the trading timeframe.
Potential Trade #1
This trade assumes that the breakdown is real.
Entry: Short at the market
Target: Take what the market gives you by trailing a stop – preferrable 2 pivot points back on the hourly charts.
Protective Stop: See the target above.
Potential Trade #2
This trade assumes that the market will retest the breakdown point – under most circumstances this will happen.
Entry: Wait for price to throw back to around 2107 and look for hourly sell-divergences or ultra-short-term trend reversals in that area. Initiate a short trade within these parameters
Target: Exit wherever price is when your favorite short-term oscillator corrects back down.
Protective Stop: A CLOSE above 2110 with a hard intraday stop at 2130.
But, But But…which trade do I take?
As a trader, one of the most important skills you can develop is the ability to hold multiple conflicting views and selecting the right one at the right time. While most other publications will show only one trade at a time, it leaves you at the mercy of them selecting the wrong trade with no idea what to do if the market does something unexpected.
A well-known trader calls this idea of holding multiple scenarios “strong opinions, weakly held”.
In other words, a trader remains flexible based on what the market is doing, not what they think it should be doing.
It is one reason why you will see us biased to the long side one day and then turn on a dime ready to execute short trades. We are simply following the price action, trying not to get so stubbornly locked into any one idea that we miss a key signal that can cause us major harm.
Handling Multiple Trade Ideas – Example
In this situation you can potentially do the following:
Immediately execute the first trade idea shown above with 50% of your usual position size. If the set-up in trade idea #2 occurs, then add the other 50%. If the set up in trade idea #3 occurs, you will have already closed out your short positions so you can then initiate the long position specified.
Another alternative is to wait for the set-up in trade idea #2 to occur and execute a short trade. If the set-up in trade idea #3 occurs, you will have stopped out of your trade and be ready to execute the long trade.
I hope you see how this works. Constructing alternative scenarios for every trade idea allows you to be flexible based on what the market is doing!
But What Happens If All Three Trades Are Losers?
Our general attitude is “so what?” We’re paid to take risks – that’s our job. 3 to 5 consecutive losing trades is normal for a trader. Sizing our positions appropriately so that we don’t panic when that happens is another core trading skill that must be developed and honed to perfection.

ES Has Broken Down While Remaining In An Up-trend
Photograph provided by shutterstock.com
Wrap Up
The ES has broken down from a 4 month consolidation while remaining in a long term up-trend. While this could be the start of a potentially bigger move to the downside (the hourly charts are in a down-trend now) and we are ready to capitalize on that, we should not forget that the big money flows are still UP.
PS: don’t forget – if you have questions about the techniques used in this article, a simple 1 hour technical analysis coaching session can get all your questions answered!


