Crude Oil At Resistance
10
May, 2020
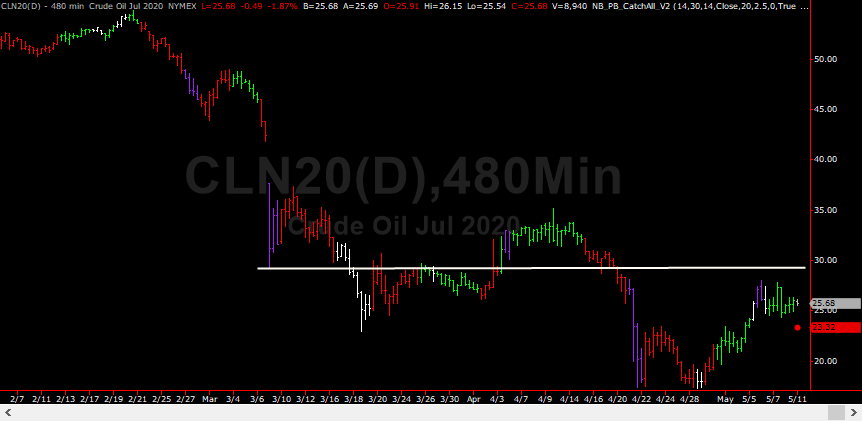
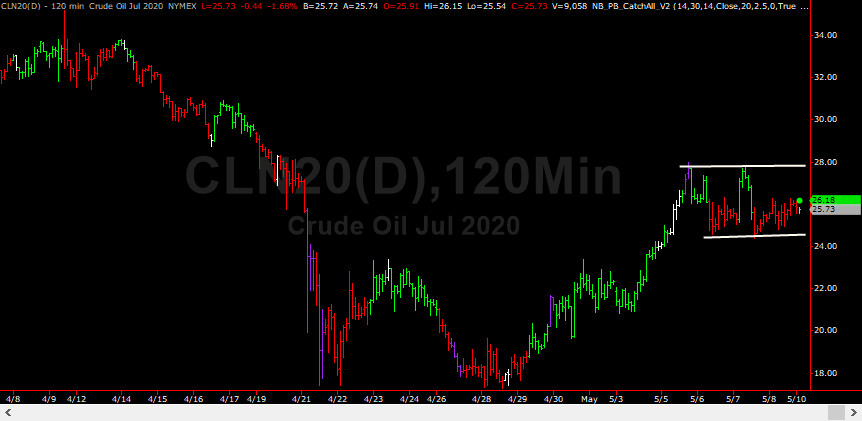
After plunging into negative territory last month just before the active contract expired, the new most active contract for NYMEX Crude is currently trading above $25/barrel. However, it has hit resistance and is forming a consolidation.
This means that there is an opportunity setting up for a short trade.
Lets take a look at our charts…
ANALYSIS
The daily chart shows the nearest resistance zone for the current price action. Price is actually falling a bit short of it but our theory is that this just indicates how weak crude has become with its rally.
The 120 min chart shows the horizontal consolidation that has formed on the hourly charts. At some point, this hourly chart will break. It could break up or break down. But we’re only interested in trading if it breaks down.
THE TRADE
The trade itself is pretty simple – we’ll use our basic breakout strategy. We will wait for the first bar to close outside the hourly horizontal line. We’ll enter a short trade there and place a stop above one of the bars inside the horizontal channel.
If price breaks UP out of the channel we have no interest in a long trade so skip the trade.
TARGETS
We will be looking for a target between $15 and $10. Assuming the trade triggers around $22 and we have a stop level around $24, that gives us a 2:1 and greater risk/reward.

Crude ready for downside break?
Photograph provided by shutterstock.com
Wrap Up
The odds are that JULY NYMEX crude is setting up a short trade with a nice risk-reward ratio. We are going to be patient and let the trade come to us instead of trying to get cute and front-running a potential breakdown.
PS: don’t forget – if you have questions about the techniques used in this article, a simple 1 hour technical analysis coaching session can get all your questions answered!


