Election Fireworks, Massive Power Sale, Upside Breakout
10
November, 2016
This article will be longer than usual since we have a number of items to cover. In particular we will cover the following:
- The prior trade recommendation (Buy) and risk control
- The massive hourly powersale pattern that set up in the middle of the election results
- The subsequent upside breakout that looks like its on its way to new all-time highs.
Trade Post Mortem
Let’s get started by examining the last recommendation we made the day before the election – you can read that here. We generally don’t do trade post-mortem’s in these articles – we do that in our coaching sessions. But because of the unusual volatility last night its a good opportunity to drive home how key some basic trading concepts are.
We had presented three trade ideas:
The first was to buy at the market – exit 50% at 2140 and pull stop to break-even
Had you executed this trade, you would have have exited 50% of your position and, critically, your stop on the other 50% would have been at break-even. THIS IS THE CRITICAL RISK CONTROL IDEA that we want to drive home – there was a protective stop in place. Anyone with a stop in place on this trade idea would not have suffered from the temporary extreme volatility to the downside.
The second was to WAIT for the first pullback on the hourly charts (a red swing)
This required some tape-reading on the part of the trader to enter when price stopped falling. Frankly, we’re not sure what most traders would have done with this trade idea – we assume that, given the volatlity, most traders would have stood aside given how hard price was falling by the time the red swing first occured.
However, had a trader explicitly followed the trade idea, there would have been some heartburn but the stop condition would not have been triggered since price did NOT close out the below the low of the triangle. Instead, it reversed and broke to the upside of the triangle!
This drives home the idea that it is the CLOSING PRICE that matters the most.
The third idea was to WAIT for the first red swing followed by the first green swing and enter at the market.
This would have been an enomously profitable trade. At no point was the protective stop in danger of being hit after the trade was entered.
The POWER-SALE Structure
One of the patterns that we like is something called a “powersale”. This is a name coined by Linda Raschke – we have adopted it because it accurately reflects the trade setup potential.
A power-sale structure forms in a DOWNTREND. It is a form of a trap. Lets take a look at the chart…
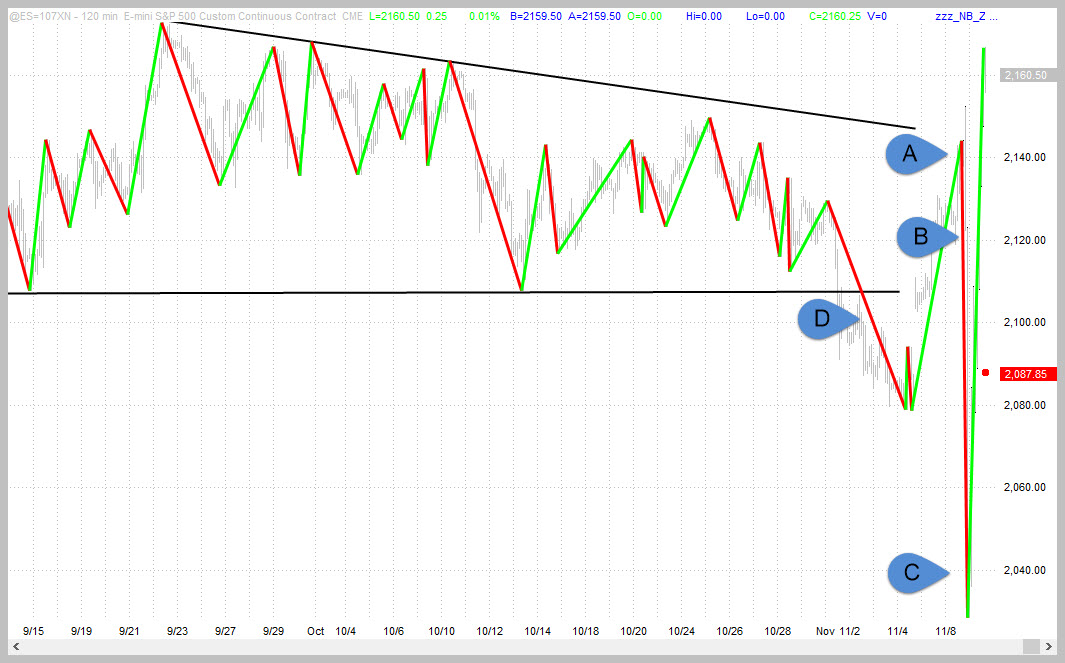
The Hourly ES charts were in a downtrend that broke below the multi-month triangle (outlined in black lines) at point D. There, it looked as if there was a breakdown that would continue for many days. Instead, price turned back into the triangle and ran all the way up to point A. But the overall structure was still a DOWNTREND even though price-action was bullish. At the time it seemed as if price was going to evolve back into an up-trend. Instead, price started falling on election night and created a power-sale structure at point B.
A power-sale structure is one that traps a lot of bulls. It looks like a trend-reversal but its not one. So, market participants who are not well versed in trend-reversal structures prematurely jump into the perceived up-trend and start buying way too early. Point B is the point of maximum uncertainty – price could keep going lower or it could turn back up, and exceed point A to create a trend-reversal to the up-side.
But, the trend is your friend. So you have to respect it.
Therefore, you have to assume that point B is a power-sale which, in this case turned out to be a MAJOR one. It ran down for over 70 points which is a large run on an hourly chart. There is no guarantee that a trader would have gotten out at the low other than the 2040 level was around an area of major support AND you had a “three-pushes-down” pattern on smaller time-frames. Regardless, a trailing parabolic stop (or any other smaller time frame trailing stop) would have taken you out for a profit at some point.
In the worse case scenario, a fixed stop at point A (which is the initial recommended stop for a power-sale) would have stopped out the trade for a loss of a few points.
Most traders looking at a quick 20+ point profit would probably have taken at least half of their trade off and pulled the stop down to break-even. It was the kind of trade where it would have been almost impossible to lose money. Trades that work out this smoothly rarely occur so when it does most traders take the money and run!
UPSIDE Breakout On S&P
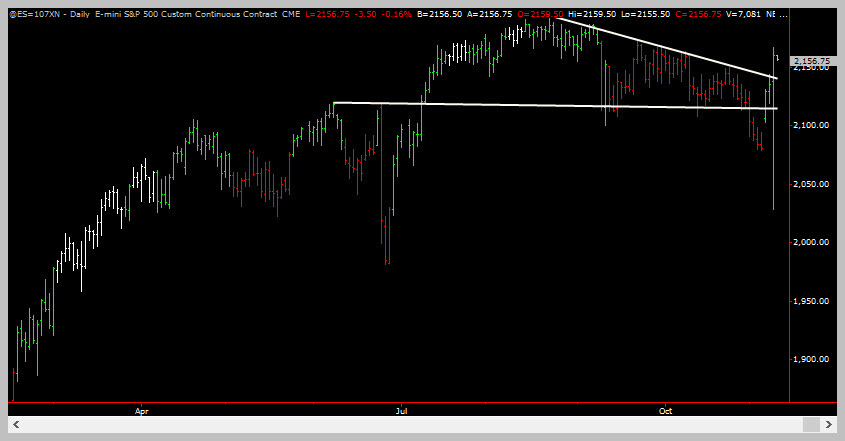
The Hourly and Daily ES charts have broken out to the upside after staging false breakdowns. Lets take a look…
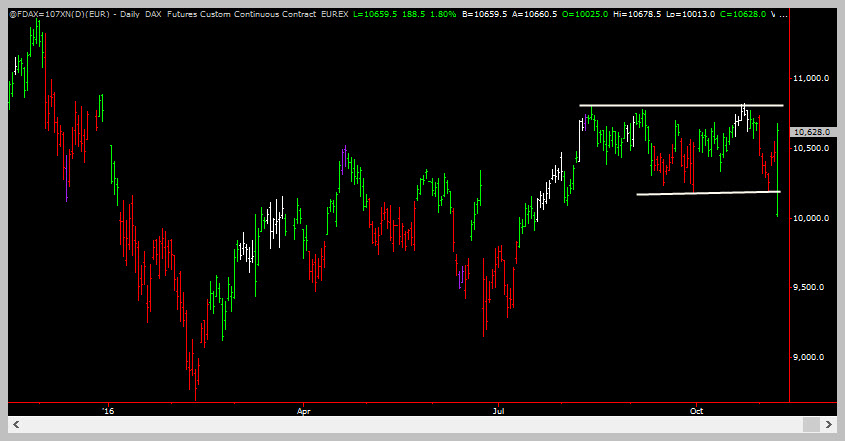
The right hand side of the chart is a complete mess! Still, being down over 4% on the day and then staging an upside breakout and blowing through resistance levels months in the making is unquivocably bullish.
Lets take a look at three other messy charts with similar price actions – just so that we keep in mind that the US stock market is not the only game in town…
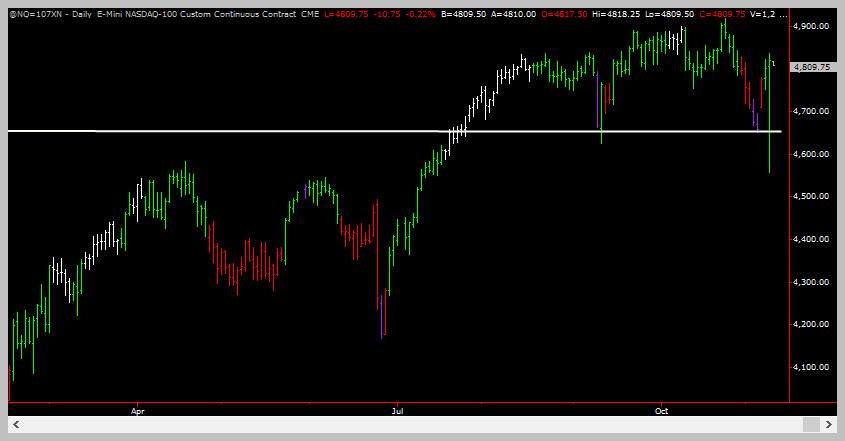
NQ: Continues Its Bounce Off Support Levels
This was the market we liked best on Sunday and we posted an article about it a couple of hours before the open. After the false breakdown last night, it roared back, reaffirming the support level (a bit messy).
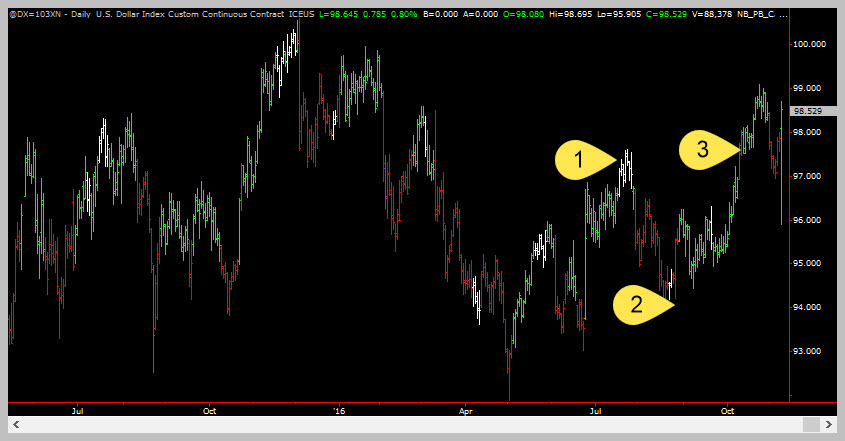
US Dollar Index: New Green Swing In Established Uptrend
This was another market we liked best on Sunday as well. It bounced from support that evening, did another false breakdown last night and now has formed a green swing. Technically this is a buying opportunity with a protective stop at 97 or so.
So, What Now For The Broader S&P (And Other Indexes?)
The Daily and Weekly charts are all in uptrends. Now, there has been an upside breakout from a multi-month consolidation. We have to respect this price action and go with it. Everything signals further upside.
Trade Idea #1
Buy At The Market – This is the most aggressive option.
Entry: Buy at the market – ES, SPY, NQ. NQ is the strongest market but ES is the broadest.
Exit: Exit 50% of your position when the ES gets above 2180 (close to highs). Pull stop to breakeven and hold the rest for an upside breakout.
Protective Stop: Exit your position upon a CLOSE below 2128 (back inside the consolidation..)
Trade Idea #2
Wait for a pullback on the hourly charts.
Entry #1: Wait for the 60 min or 120 min chart to show a red swing. Enter at the market. Do not enter if the red swing occurs back inside the consolidation though! If that happens, see trade-idea #3 instead.
Exit: Exit 50% of your position when the ES gets above 2180 (close to highs). Pull stop to breakeven and hold the rest for an upside breakout.
Protective Stop: Exit your position upon a CLOSE below 2128 (back inside the consolidation..)
Trade Idea #3
Another variation on waiting for an hourly pullback.
Entry: Wait for the 60 min or 120 min chart to show a red swing . Enter when the swing changes to green again.
Exit: Exit 50% of your position when the ES gets above 2180 (close to highs). Pull stop to breakeven and hold the rest for an upside breakout.
Protective Stop: Exit your position on the swing low that forms after the new green-swing.

ES Powering Up!
Photograph provided by shutterstock.com
Wrap Up
The ES has roared back once again to retrace a large portion of its losses from deeply oversold levels. And it is well above its breakdown point on the hourly charts. This, along with sentiment and aggregate fund cash positions, is very bullish for the overall market.
We presented three bullish trade ideas above – one aggressive and two conservative. We hope that you’re able to use these ideas to create trades that suit your unique trading style!
PS: don’t forget – if you have questions about the techniques used in this article, a simple 1 hour technical analysis coaching session can get all your questions answered!

