Master Day Trading in Just 30 Days: Lesson #14
14
Lesson #14
We’ve spent the last few lessons looking at and trading trend reversals. But, we’ve been doing this primarily on small intraday charts in order to make scalp trades. It is time to apply the concept to daily charts.
When applied to daily charts, trend reversals allow you to catch many major trends early in their move. You might end up missing the first 10 percent but you will catch the meat of the trend.
Basically, these trend reversal concepts allow you to come awfully close to CONSISTENTLY catching tops and bottoms.
The keyword here is CONSISTENTLY. Some traders will get lucky “winging” it and catch a top/bottom or two. But for any type of CONSISTENCY, you need a process – this is that process.
As with all things trading related, the longer you hold on to a trade and the bigger the target you’re shooting for, the lower the percentage of winning trades you’ll have. BUT, ironically in the long run you can make MORE money with a lower percentage of winning trades – because the magnitude of the moves in the winning trades are so much larger than compared to the amount you would give up in losing trades!
Still, this lesson is about catching the move, not to rehash the numbers game concept we covered in prior lessons.
So, lets take a look at some trend reversals on daily charts…
Example #1: Trend Reversal On Nikkei Futures
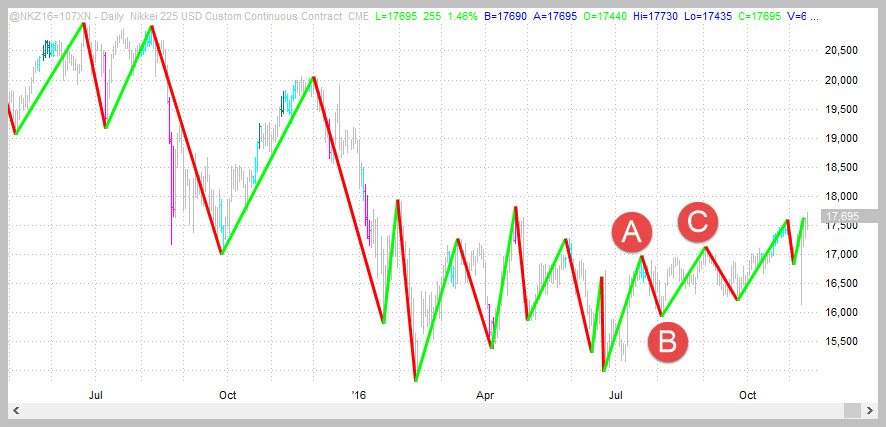
Here is a recent trend reversal (at the time of this writing) on the Nikkei – the reversal occured about a month before the US 2016 presidential elections.
Point A was the first HIGHER-HIGH, point B was the first HIGHER-LOW and point C is where the second HIGHER-HIGH occured and the trend reversal was confirmed. We fully expect this market to run back up to 20,000+
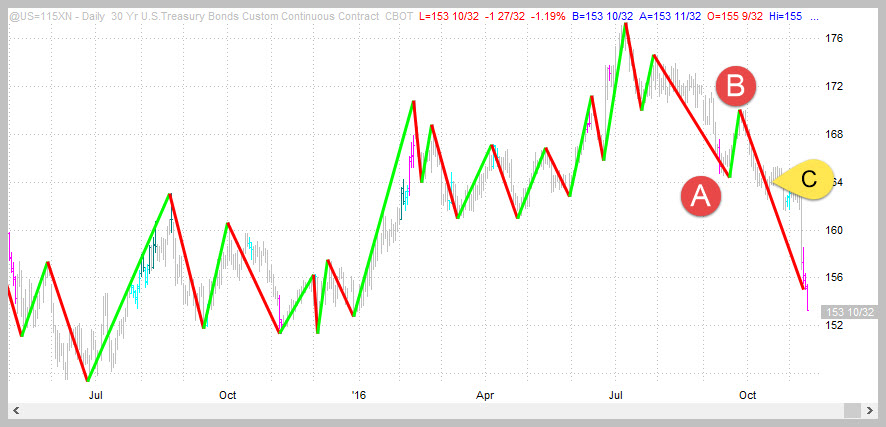
Example #2: Trend Reversal On 30 Year Bond Futures
Point A on the chart was the first LOWER LOW, point B was the first LOWER HIGH and point C is where the trend reversal was confirmed.
Get More Examples And Learn More About Identifying Tops And Bottoms
Lets take a look at more chart examples.
Keep in mind that these are all on the daily charts and so identified a top or bottom relatively early on in the process.
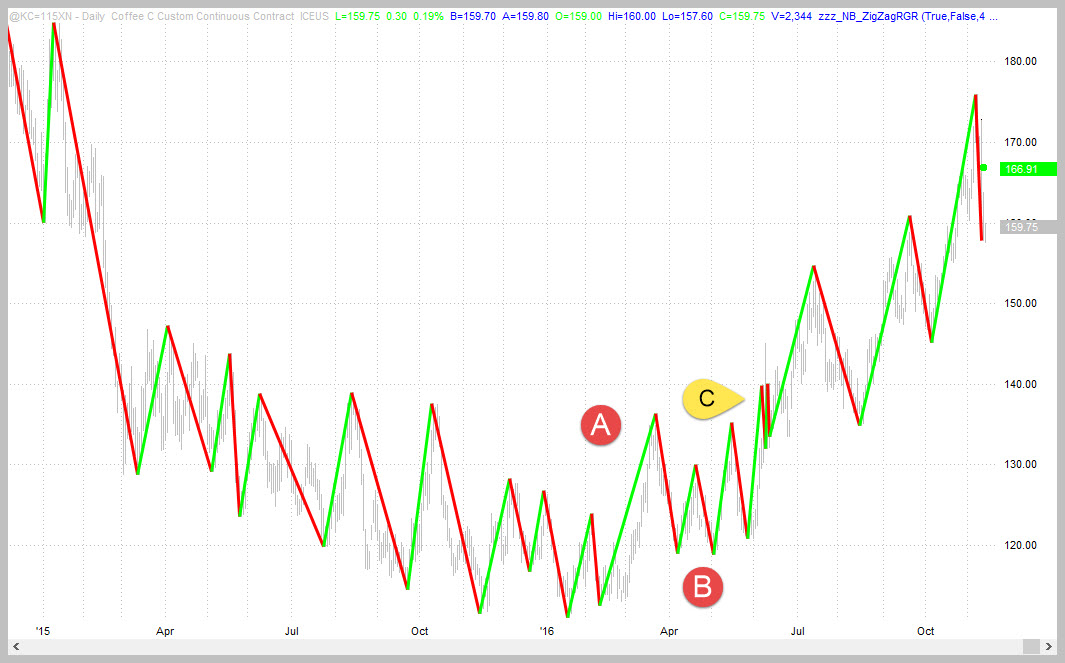
Coffee
- A = Higher High
- B = Higher Low (complex formation which we haven’t talked about but you should know that this is possible)
- C = 2nd Higher High and trend reversal confirmation
Additional Examples…
Chart images provided by Tradestation Charting Software
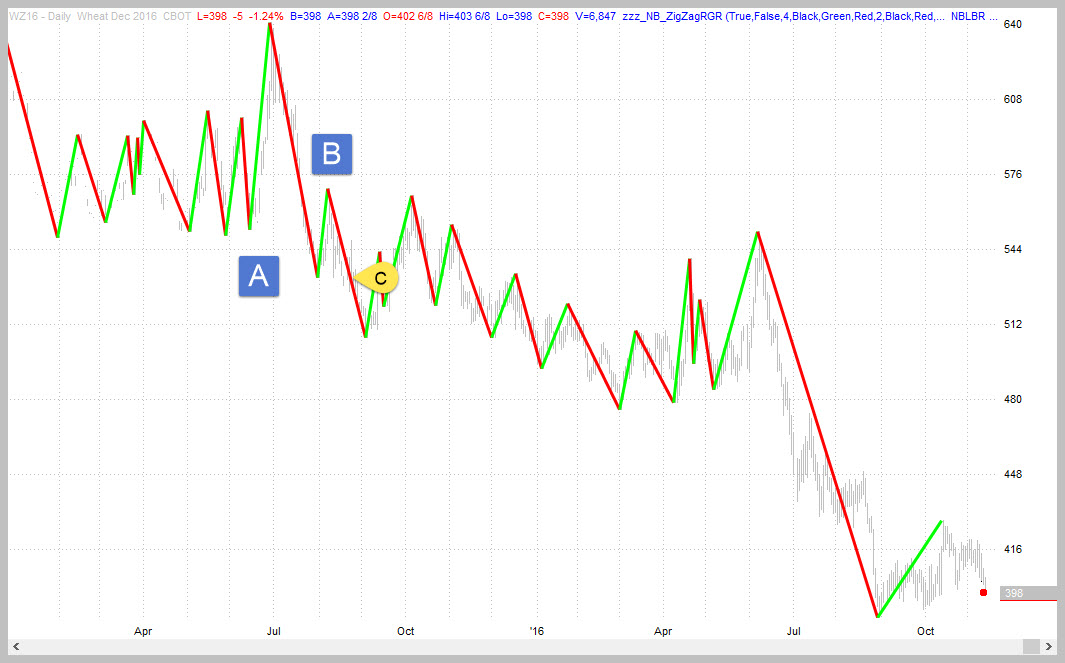
Wheat
- A = Lower Low
- B = Lower High
- C = 2nd Lower Low and trend reversal confirmation
Can you find a failed trend reversal in 2016?
Fakeouts
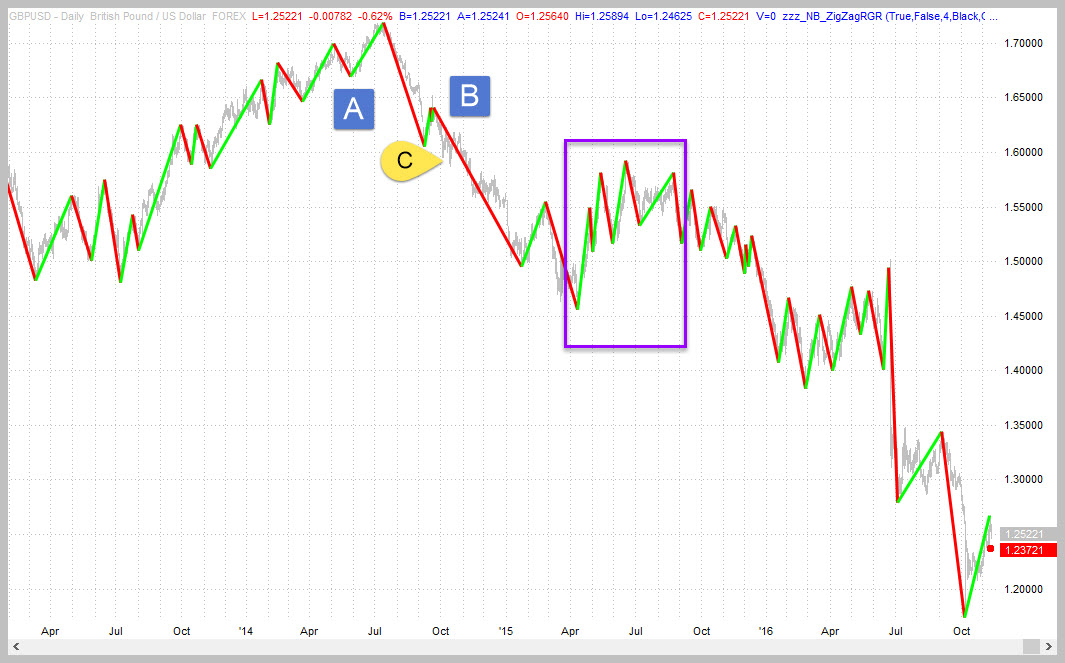
As you can see, it is possible to get in very early in a trend. Additionally, once you know the daily trend it makes it relatively easy to buy or short pullback/throwbacks with high confidence. However, as with anything else, trend reversals can be fakeouts where they only last for short periods of time!
An example of a FAKEOUT is shown in the purple box below – in there is an example of a trend reversal UP that is quickly negated by a trend reversal down. It is important to realize that when this happens it usually means that the main trend is unusually strong and liable to kick back in with a vengeance. As shown in this example the down-trend just accelerated after the fake-out and still has not ended!

Wrap Up
This lesson is about two things:
- Capturing tops and bottoms with trend reversals on daily charts.
- Showing more examples of trend reversals.
By now you should definitely know what to look for trying to figure out the dominant trend. A trend remains in force until another trend reversal negates it. So, even if price is going sideways, the dominant trend will be the last confirmed trend reversal – you should be trading in that direction EVEN in a sideways market!

Coming Up Later
- Money management and risk control
- Using multiple time-frames to fine-tune your trading entries
- Determining how to set your stop points and the trade-offs of each tactic

