Master Day Trading in Just 30 Days: Lesson #16
16
Lesson #16
In the last lesson we covered basic support and resistance concepts. Swing highs and lows were discussed as one of our favorite points of support and resistance.
This lesson will cover our second favorite support and resistance level – consolidations.
Consolidations are, in our opinion, the best indicator of a support or resistance level. The price overlap that forms from a consoildation is indicative of the struggle going on between the bulls and the bears. Prices moving away from those areas tell you which side won. And if price returns to those areas then chances are the prior winner will win again.
What Is A Consolidation Area?
A consolidation area is identified by TWO “converging” or parallel trend lines, each of which is drawn across two or more swing highs and lows. (Now you see why we needed to define Swing Highs and Swing Lows in the prior lessson!)
This concept of converging or parallel trend lines is best done by example so here are six charts for you to learn from.
Parallel Trend Lines
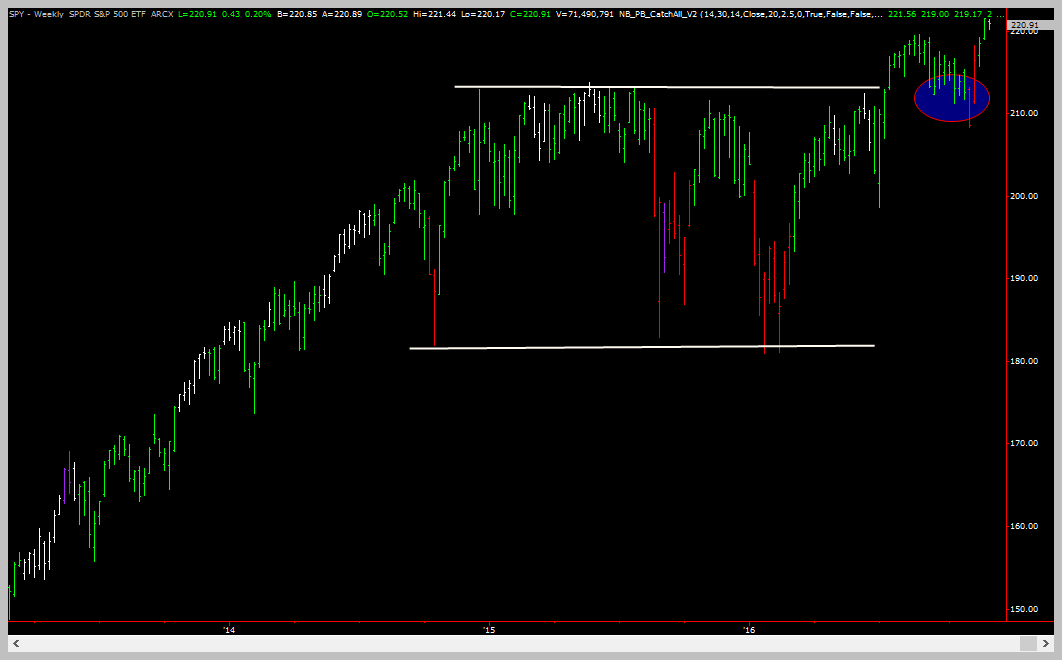
The chart below shows a very large consolidation area whose boundries are defined by horizontal trend lines. If you look to the right you will see that prices broke up above the area but came back down and found the area acting as support (blue circle). Prices then rallied to new highs once support was confirmed.
Converging Trend Lines
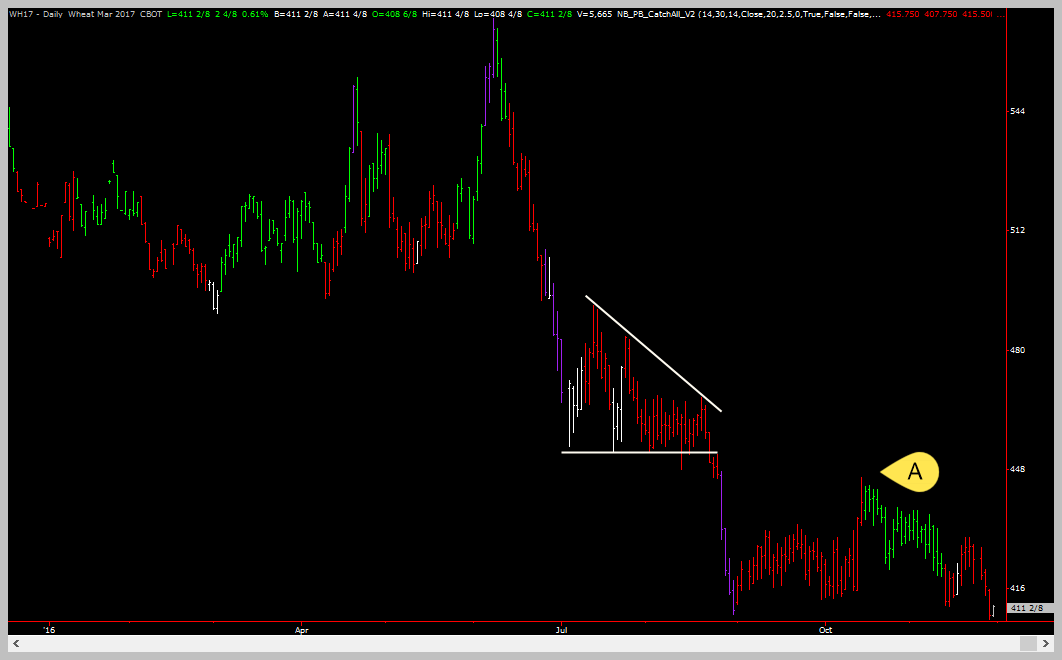
Here is a smaller consolidation area defined by converging trend lines.
Looking to the right you can see that price almost rallied back up to the area and met resistance (Point A) but fell away again to make new contract lows!
Converging Trend Lines
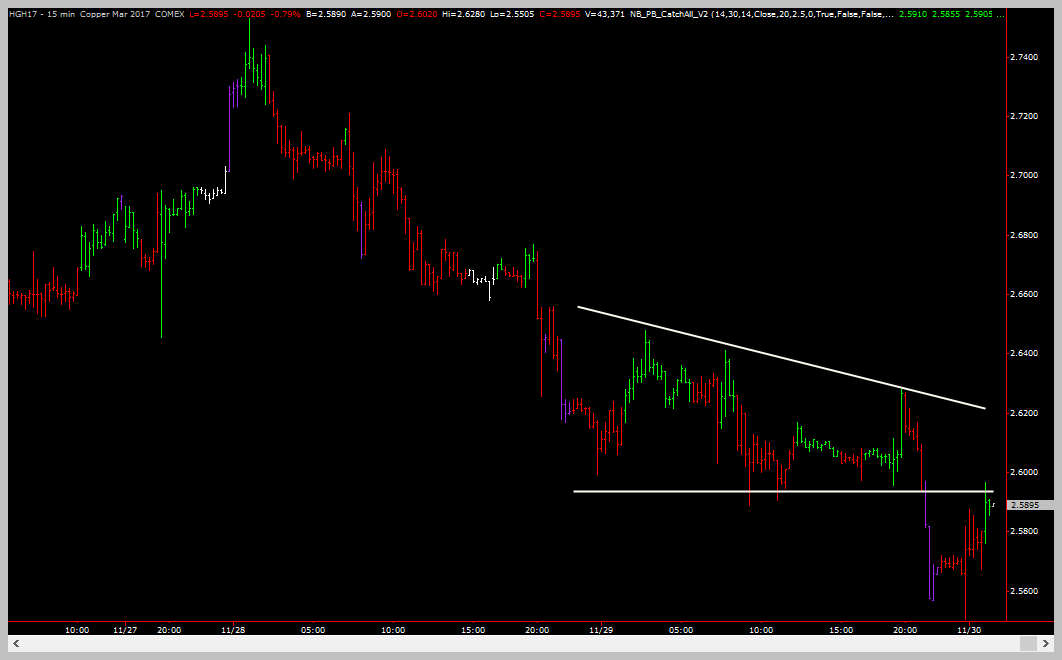
This example shows converging trend lines defining a consolidation area. You can see on the right side of the chart that price has rallied back up to the consolidation area and is pausing – confirming that the consolidation is most likely going to continue to be a resistance level.
Converging Trend Lines
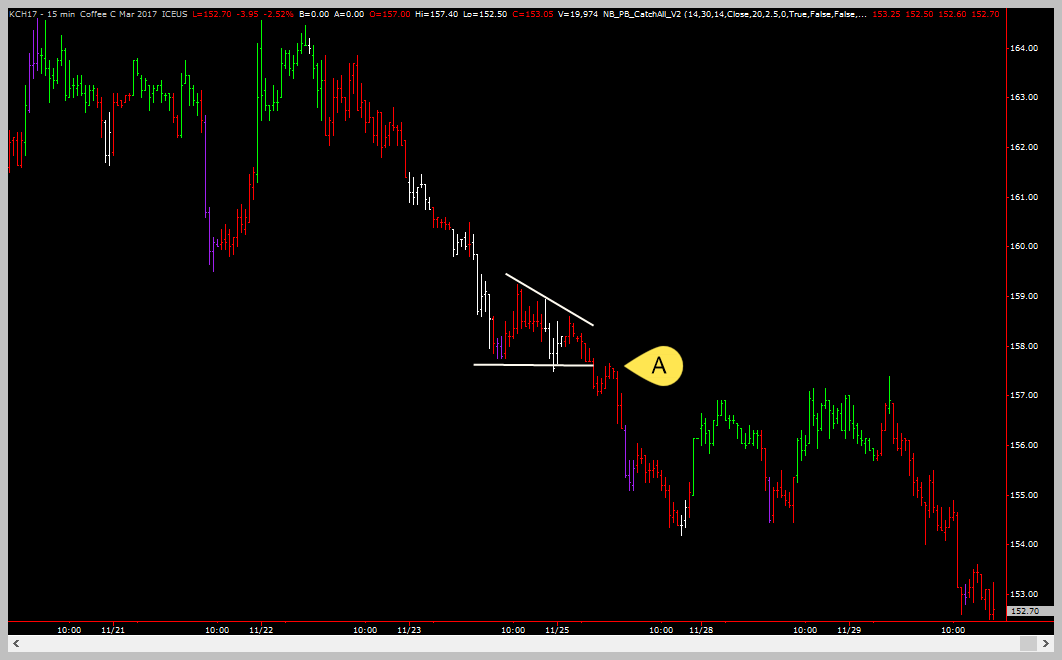
This chart shows a small consolidation area defined by converging trend lines. Point A is where price rallied back to the area and met resistance. You can see the price then fell away from the area. But if you look to the right you can see that the area was challenged multiple times, always falling back though and eventually moving on to make new lows.
Parallel Trend Lines
Here is a very large horizontal consolidation area. Once prices break up or down from this area you can expect it to act as very strong support or resistance.
Converging Trend Lines
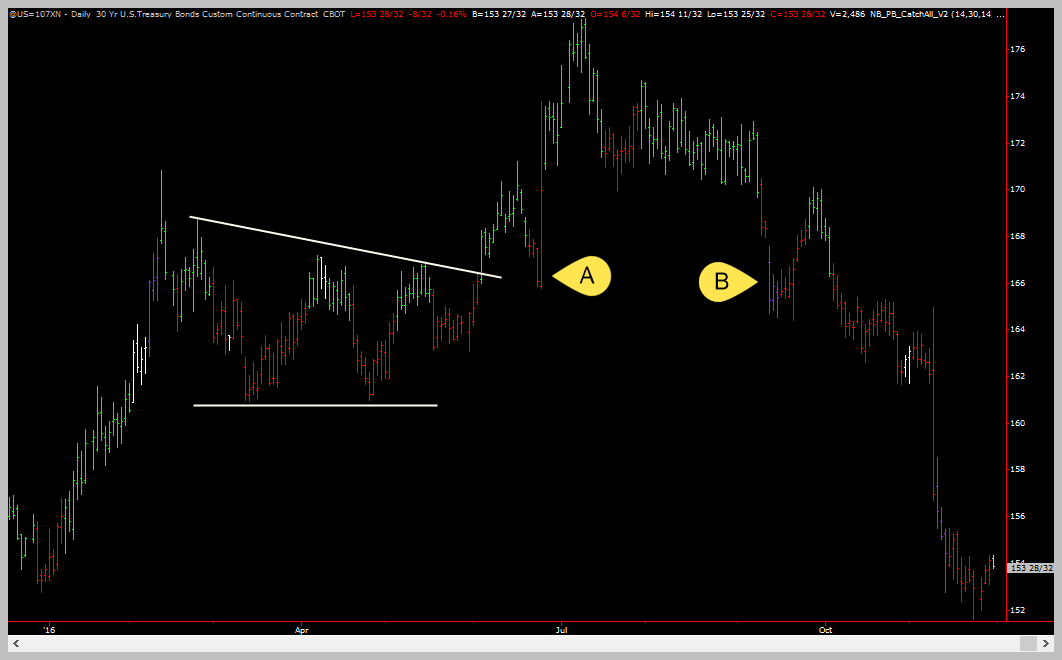
This chart of bonds show a large consolidation area. Point A is where price fell back and the area acted as support, propelling prices to new highs.
Point B is where the area acted as support again and prices rallied. But this time not that far. Price eventually broke down completely to make new lows. NOW, this area will be a RESISTANCE area if price ever gets back up there!
Learn All About Consolidations And Breakouts
There are rules that determine when and how to draw the trendlines, how to play breakouts, where to set your stops etc. A total of 5-7 rules that govern everything related to consolidations!
Consolidations Are Powerful Chart Features
A trend is the most powerful chart feature there is. Being able to accurately identify the current trend is probably the most important chart reading skill you will ever have. But – closly following that in importance are consolidations. Consolidations can act as support and resistance levels AND as breakout points. In fact, we estimate that at least 80% of new trends emerge from a consolidation area!

Wrap Up
This lesson was one of teaching by example. Apart from identifying the most common trend, knowing how to identify consolidations is your second most important chart reading skill!
In our next couple of lessons we will demonstrate how to use consolidations to time your trades using multiple time frames.

Coming Up Later
- Money management and risk control
- Using multiple time-frames to fine-tune your trading entries
- Determining how to set your stop points and the trade-offs of each tactic

