
Master Day Trading in Just 30 Days: Lesson #7
07
Lesson #7
In this seventh installment of our day trading training series, we are going back to some theory. You spent the last few lessons doing drills, so now it is time to talk a bit about charts and chart theory.
What Do Charts Tell us?
The most basic information that charts convey is the cost of the item IN THE PAST. It does not tell you anything about what will happen in the future. Charts are not used to predict the future — they are instead used to infer information about the PROBABILITY of something happening in the future and, more importantly, set risk points for your trades.
Charts are the “footprints” of buyers and sellers. It is a visual representation of their psychology. Repeatable chart patterns form because human nature is slow to change — if a pattern occurred once, then it is likely to occur again in the future. However, chart patterns (and charts in general) cannot guarantee knowledge about future price movements. Some patterns usually resolve themselves in a particular way, but there is no certainty that they will be resolved the same way in the future.
Chart Types
The two most popular chart types are BAR CHARTS and CANDLESTICK charts. For the purposes of this course, it doesn’t matter which type you prefer, but you should pick one and stick with it. We will be using BAR CHARTS for all our chart examples, though — primarily because you can put more of them on a chart, since they are thinner than candlesticks. And because we’ve conditioned our eye and instincts using them over the years — in other words, we are used to them.
Other chart types that you might see in the future include:
- Market Profile
- Point And Figure
- KAGI
- KASE
- Line Break
- Range
- Renko
While each type of chart conveys information in a slightly different way, this is a practical course designed to get you productive as fast as possible, so we will stick to one type of chart. After you have completed this course, you should have enough information to be able to research these other types of charts and make intelligent decisions on whether or not they can be useful to your trading.
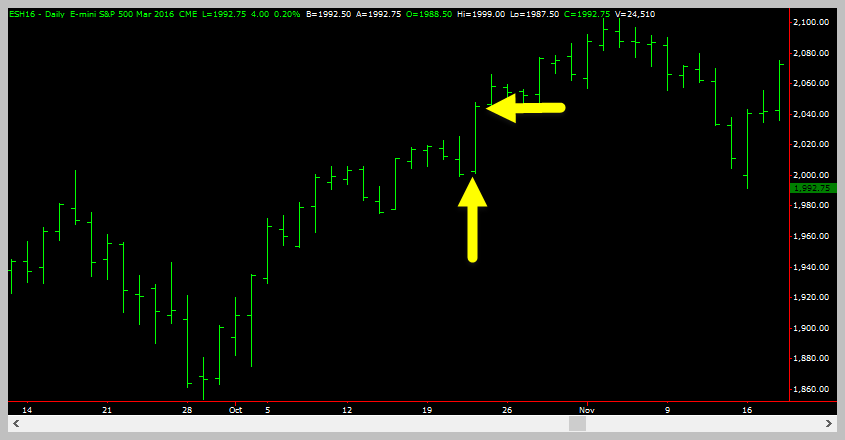
The image above shows a basic bar chart. The vertical arrow is pointing to the left tic which is the opening price level for the bar. The horizontal arrow is pointing to the right tic on the same bar which is the level of the closing price.
Bar Chart Components
A price bar on a financial instrument chart consists of simple vertical bars with tics on either side of them that show where the bar opened and where it closed. The tic on the left side indicates the opening price, and the tic on the right side indicates the closing price. The convention is that a close below the open will color the bar red, and a close above the open will color a bar green. However, many charting packages allow you to choose your own colors, so you are not restricted to this convention.
A complement to the chart itself is volume, which is usually placed beneath the price bars. There are a few instances where you can discern additional information using volume, but 95% of the information you need to make a trading decision is going to be in the bar chart itself.
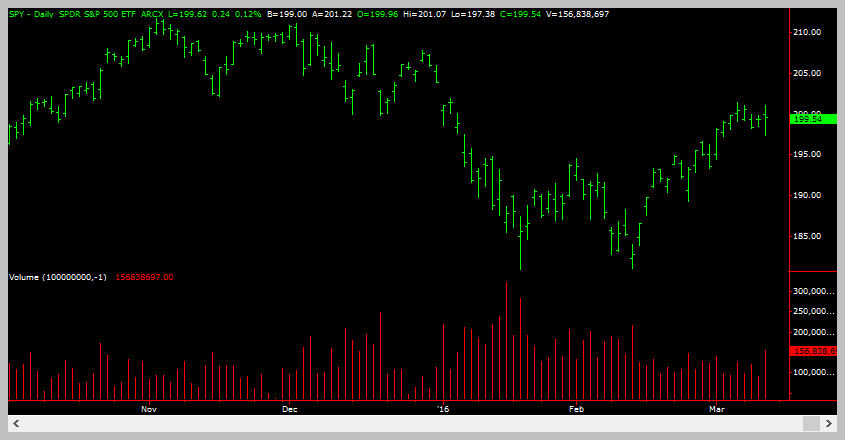
The above image shows a basic bar chart with volume bars plotted beneath.
“Charts are the “footprints” of buyers and sellers. It is a visual representation of their psychology.”

Candlestick Chart.
Photograph provided by canstockphoto.com
Bar Intervals
Each bar on a chart usually represents a fixed period of time, e.g., 15 mins, 5 mins, 1 day, 1 week, etc. However, most modern charting software allows you to create bars based on volume and “ticks” where a tick is one or more trades at the same price level. For this course, we will be using Daily Bars (1 day), and hourly intraday bars — 60 min, 120 min, 240 min, and 480 min.
One of the most common questions we get is why did we choose those intervals? It’s simple — each interval is double the prior interval. There is nothing magic about our choices. You can choose to look at the intraday charts in 61, 122, 244, and 488 minute bars if you wanted. The key to bar intervals is to remain consistent. By using the same intervals, you help your subconscious to develop, thereby developing better instincts over time. Changing the chart intervals on a regular basis does not allow that instinct to be developed. Using the popular car analogy — how well would you drive your car if you changed your dashboard and steering wheel every week?
Indicators
Indicators are algorithmic transformations of the four key components of a bar — opening price, closing price, the highest price on the bar, and the lowest price on the bar. Some indicators use volume as well. At the end of the day, there are hundreds of different indicators, each with its own algorithm for transforming and smoothing out price movements. Used properly, they can be quite beneficial. And, as you saw in your drills, they can serve a purpose. But, if we had to go back in time and re-do our learning process, we would remove all indicators from our charts from Day One. That hindsight is going to be passed onto you, because the charts we use will not have indicators on them. Later (much later) in the course, we will introduce some indicators and provide feedback on the specific circumstances under which they can be useful.
Many traders use indicators and use them profitably but, again, we’re making a choice in this course as to what to teach to best help you get started, and so we will teach chart interpretation without using indicators.
Therefore, for now, if you read trading books or articles on the internet about magical indicators, you should probably run as far as you possibly can. You don’t need that temptation distracting you from the progress you’re making (or can make) in this course.

Sample Charts
Photograph provided by shutterstock.om


Terminology
Photograph provided by shutterstock.com
Terminology
Price Gap (Gap): A Gap is a break between prices on a chart that occurs when the price of an instrument makes a sharp move up or down with no trading occurring in between. Gaps occur regularly in stocks and can be created by factors such as regular buying or selling pressure, earnings announcements, a change in an analyst’s outlook, or any other type of news release.
Average True Range (ATR): Average True Range is a price transformation function and can be termed an indicator in its own right. But it’s frequently used as a component of other indicators.
- Before you can compute an Average True Range, you need to compute the value of the True Range for the day.
The True Range is the greatest of the following: - The price difference from today’s high to today’s low
- The price difference from yesterday’s close to today’s high
- The price difference from yesterday’s close to today’s low
With the True Range for each bar in hand, you can compute the Average True Range, which is a simple moving average of the True Range.
How do you feel after you have completed this exercise? Let us know by using our contact form! We would love to hear from you!

Wrap Up
The key take-away from this lesson is that charts only tell you what has happened. By studying what has happened you can develop a feel for the probabilty of what will happen.
Charts to NOT forecast the future!
But they do allow us to make prudent risk-based decisions. And that is a very very powerful thing.
Coming Up Next
- The Components of Chart Structure
- “Legs”
- “Leg” transitions
Later
- Market structure as shown on charts and how that helps your profitability
- Defining legs and swings on the charts, which will help the precision timing of your trade entries and exits
- All about trend reversals, so you can enter new trends early

PSYCHOLOGY
Why You Should Never Give Up On Trading

TRAINING
Master Day Trading In Just 30 Days: Lesson #1

TRAINING
Three Golden Rules That Could Save You Thousands