
Master Day Trading in Just 30 Days: Lesson #8
08
Lesson #8
In this installment of our day trading training series, we are going to start to learn how to add some structure to a chart. Charts look random — in fact, if you turned a bunch of charts upside down and randomly mixed them in with charts that are right-side up, you probably couldn’t tell which were upside down and which were right-side up. So how can something so random provide any kind of useful information?
The answer to that question is simple — within that sea of apparent random chaotic data are pockets of organized data and it’s your job as a trader to suss out that organization.
Chart Structure Components
Let’s start with something very obvious — within a chart, you can see periods of time where price is going up, and periods of time where price is going down. If you draw a straight line from the bottom to the top of the upwards price movement, and then do the opposite for downward price movements you get something that looks like this:
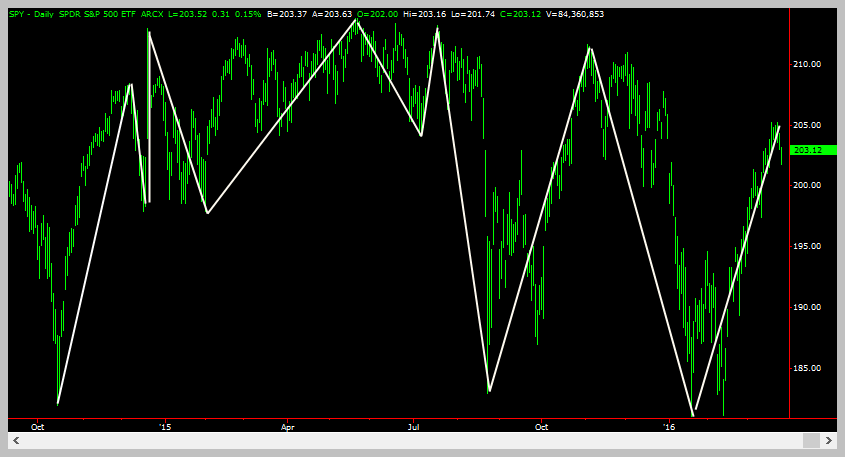
Drawing these lines to connect upwards price movement and downward price movements help to eliminate some of the chaos that a beginning trader will perceive in a chart. It allows us to FILTER the noise from a chart and to focus on the bigger picture. In fact, if you remove the price bars you get something that looks like this:
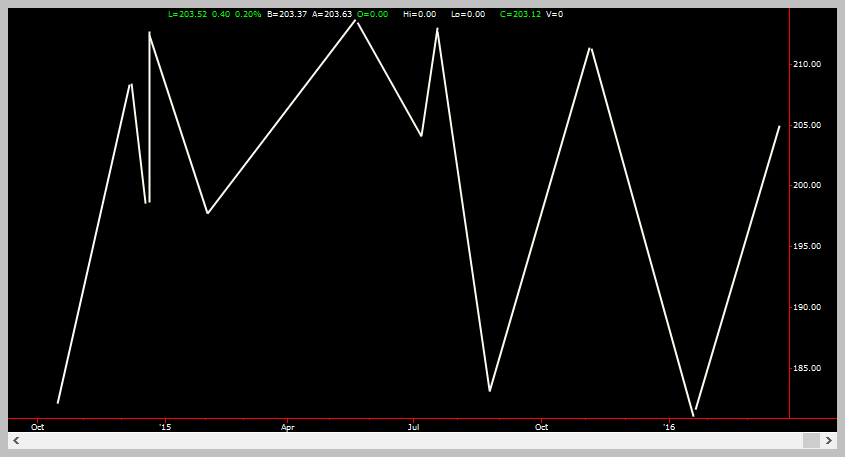
Believe it or not, you can use just this set of lines to make trading decisions and to plot trade setups! For now though, let’s get some terminology out of the way.
2. A line connecting the bottom to the top of an upward price move is called an “up-swing” or “up-leg”.
3. A line connecting the top to the bottom of a downward price move is called a “down-swing” or “down-leg”.
We will be using this terminology extensively for the remainder of this series, so you might want to bookmark this page for easy reference later.
“…if you turned a bunch of charts upside down and randomly mixed them in with charts that are right-side up, you probably couldn’t tell which were upside down and which were right-side up…”
Leg Transitions
The more observant trader will immediately recognize that there is a problem with how the legs are drawn. We have not provided any rules for when to stop the up-leg and start drawing the down-leg (and vice-versa.) While we might have chosen to draw our up-swings and down-swings as shown in the chart above, another trader might have chosen to draw them a lot looser:
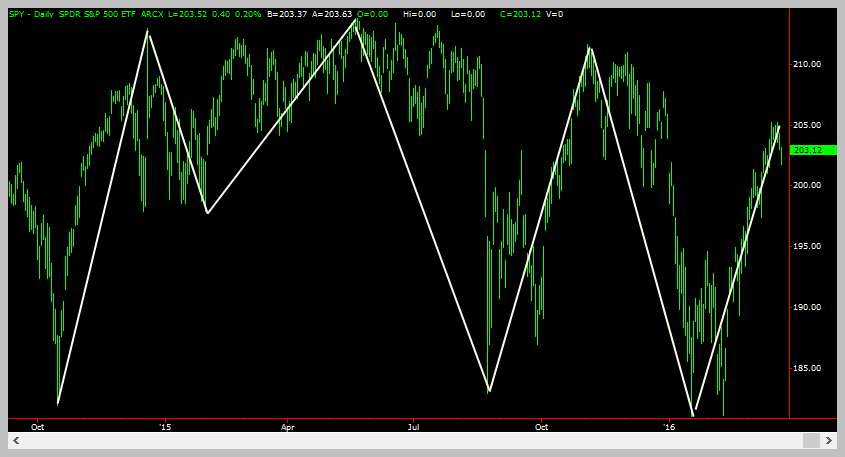
While its probably not obvious at first glance, notice that the left side of the chart has fewer white lines.
Alternatively, the trader might choose to draw the legs tighter, such as shown in the chart below.
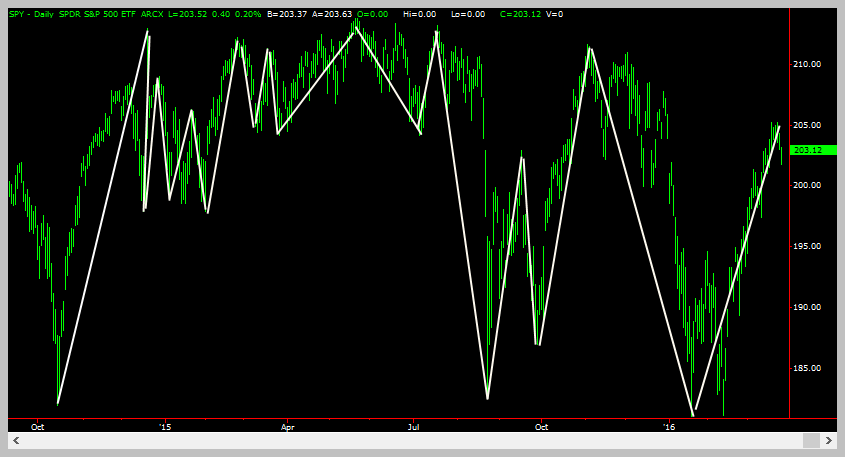
Notice the much larger number of white lines (legs) that are now on the chart.
This poses a bit of a conundrum, because if you want to trade consistently, then you need to interpret the charts using a consistent methodology. Thus, there has to be rules around how these legs are drawn, so that multiple traders will always draw the same set of legs. That is what we will discuss next time.

Sample Charts
Photograph provided by shutterstock.om


Terminology
Photograph provided by shutterstock.com
Terminology
Since we introduced three new terms already above, there’s no point in introducing any new ones here. Legs, Up-Swings and Down-Swings are all you need to remember for terminology from this lesson.
How do you feel after you have completed this exercise? Let us know by using our contact form! We would love to hear from you!

Wrap Up
This was a much shorter lesson. After so many long ones, we figured it was time to provide information in a more bite-sized format. Our next lesson will cover the rules for drawing the legs/swings on the charts. This will set the stage for our first lesson where we actually pull useful information out of a chart. So get ready, we’re about to hit the accelerator!

Coming Up Next
- Precise definition of a swing
- More “Legs”
- More “Leg” transitions
Later
- Market structure as shown on charts and how that helps your profitability
- Defining legs and swings on the charts, which will help the precision timing of your trade entries and exits
- All about trend reversals, so you can enter new trends early

PSYCHOLOGY
Why You Should Never Give Up On Trading

TRAINING
Master Day Trading In Just 30 Days: Lesson #1

TRAINING
Three Golden Rules That Could Save You Thousands