S&P500 Confirms Memorial Holiday Breakout
Last week on May 24th the ES broke out of a trading range. But, since it was the week before Memorial Day weekend we took it with a grain of salt. Sure enough we had a pullback that retested the breakout level.
Now, because of that re-test and with the holidays behind us we can take the breakout more seriously.
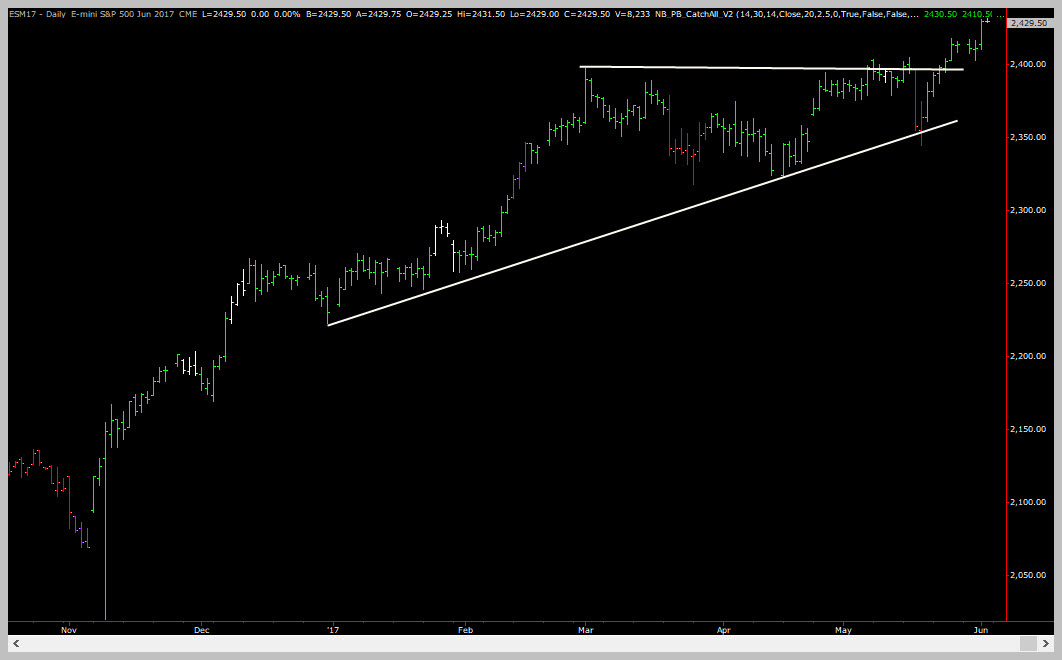
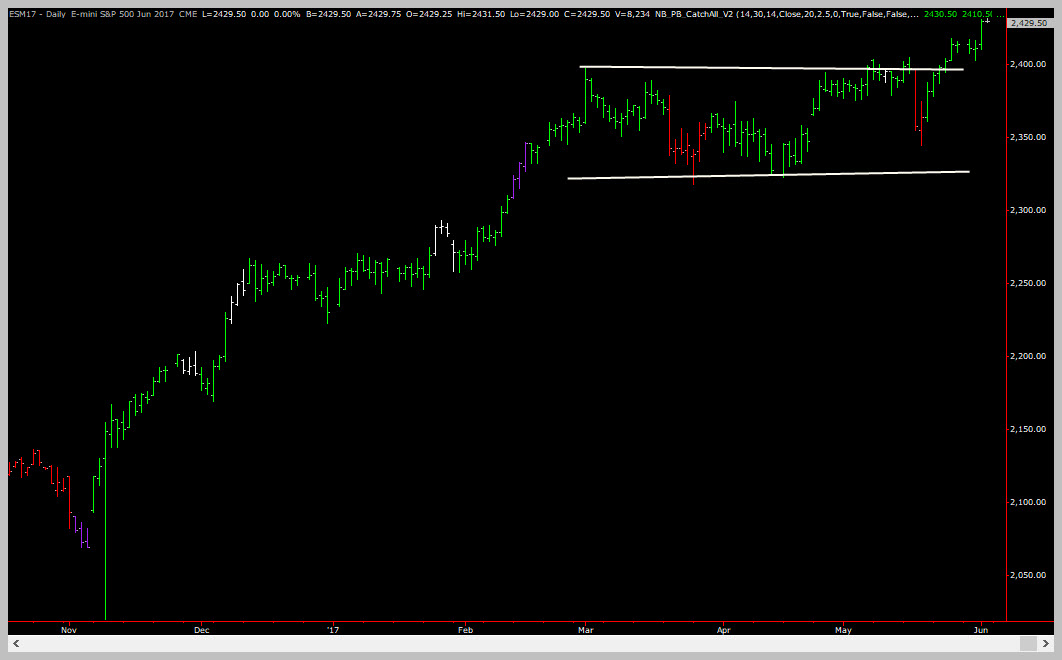
The first thing to realize is that we can look at the consolidation pattern two different ways. But either way still gives us the same breakout level. The difference is in the SIZE of the consolidation. In technical analysis the size of a consolidation area directly relates to the expected length of the move afterwards. So the narrower area would set our expectations for a smaller move out of it.
Below we show both options for defining the consolidation area – we prefer the one with the horizontal white lines on the right.
Lets take a closer look at the price action and why it gives us more confidence in this potential trade to the long side.

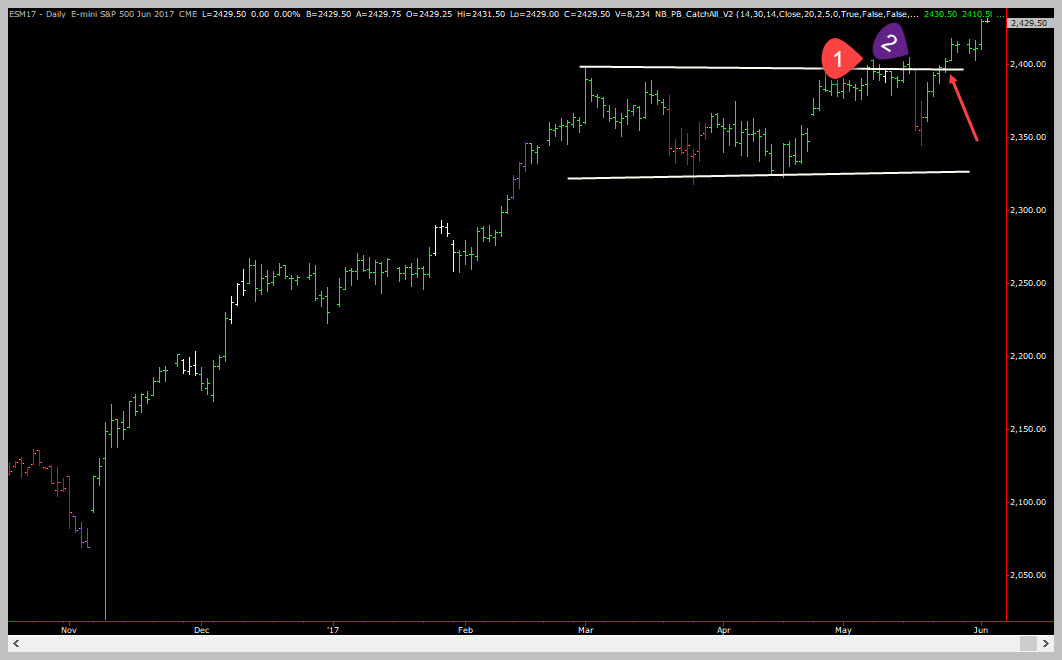
In the chart above, points 1 and 2 are where you have a couple of breakout attemps and they both failed. In fact, point 2 is where the failure took price close to the bottom of the range – which is usually what is expected after a breakout failure.
However, look at the bar where the red arrow is pointing – this is the small breakout on May 24th. Initially we were skeptical about this breakout. In fact, you had all kinds of reason to be skeptical about this breakout:
- Holiday Week
- Seasonality
- P/E ratios to the extreme
- Trump issues
But, after this bar, all price did was go sideways, then flushed to retest the breakout point. Todays action zoomed price to new all time highs. This is bullish. The fact that price is able to make new highs in the face of all bearish news is impressive and needs to be respected.
So, the best trading idea we have is this one:
Whoops, this content is only for members. If you have a membership, please log in. If not, you can definitely get access! Purchase a membership here.

ES Daily Long Trade Setup
Wrap Up
ES / SPY daily charts have created a sweet long trade setup with a very nicely defined risk point. Trades like this onl come along a couple of times per month. Even if we’re wrong on this we would take this setup the next time, every time!
PS: don’t forget – if you have questions about the techniques used in this article, a simple 1 hour technical analysis coaching session can get all your questions answered!


